Master the Trend: How to Use the 200-Day Moving Average as Your Ultimate Filter
Ever felt like you’re buying into a rally just as it collapses, or selling a dip right before it rockets higher? You’re not alone. The secret many seasoned traders use to avoid these traps is a simple but powerful tool: the 200-Day Moving Average (200-MA). Think of it as the market’s long-term compass. When price is above it, the trend is your friend. When price is below it, caution is key.
How It Works
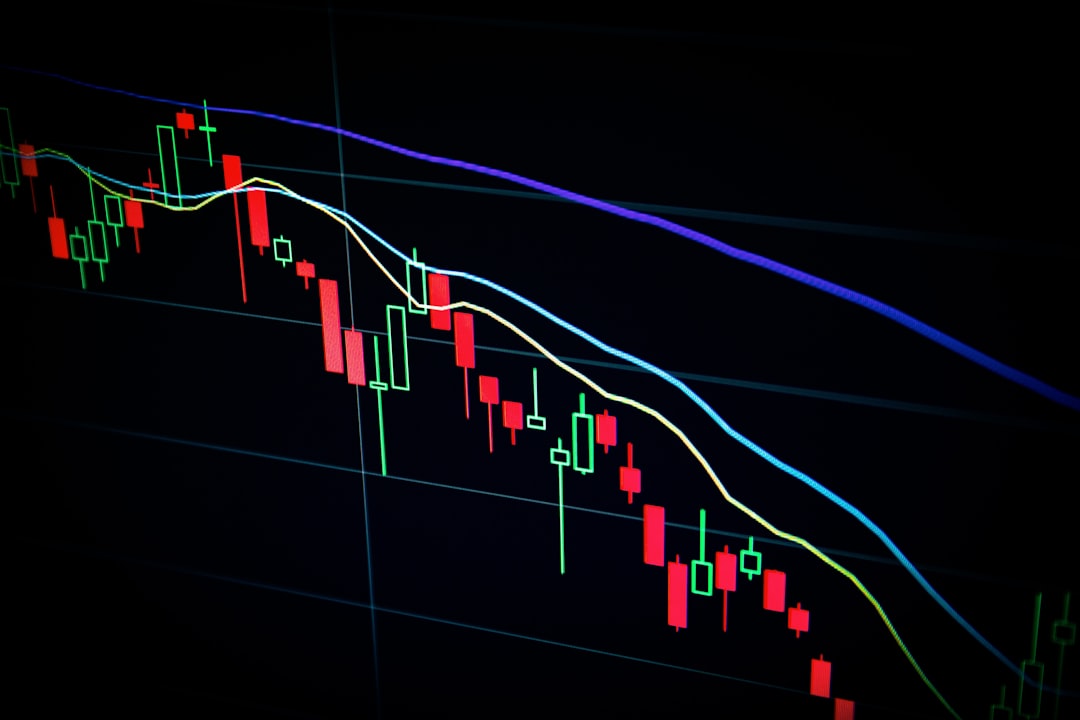
The 200-MA smooths out price data over the last 200 days, giving you a clear picture of the overall market direction. It acts like a dynamic support or resistance level. If the price is consistently above the 200-MA, the market is in a long-term uptrend. If it’s below, the market is in a downtrend. This filter helps you avoid buying into bear markets or shorting strong bull runs.
The Setup
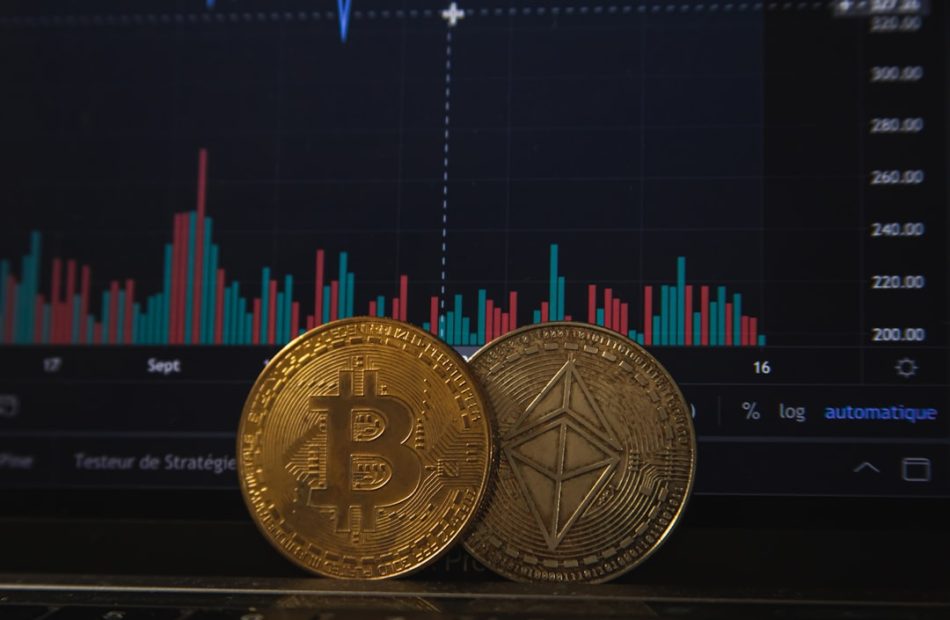
1. Pick Your Asset: Any liquid crypto like Bitcoin, Ethereum, or major altcoins work well.
2. Add the Indicator: On your chart, apply a Simple Moving Average (SMA) with a period of 200.
3. Define Your Rules:
- Long Trades only when price is above the 200-MA (uptrend).
- Short Trades only when price is below the 200-MA (downtrend).
- No trades when price is chopping around the 200-MA—wait for a clear break.
For example, if Bitcoin is trading at $30,000 and the 200-MA is at $28,000, you only look for buy setups. If it drops below, you switch to shorts or stay in cash.
Risk Management
Even the best trend filter isn’t perfect. Always use stop-losses:
- For longs: Place a stop 2-3% below the 200-MA.
- For shorts: Place a stop 2-3% above the 200-MA.
- Position size: Never risk more than 1-2% of your account on a single trade.
Remember, the 200-MA is a lagging indicator—it reacts to price, not predicts it. Combine it with volume or RSI for confirmation.
Conclusion
The 200-Day Moving Average trend filter is your roadmap to trading with the wind at your back. By only taking trades that align with the long-term trend, you dramatically reduce your risk of getting caught in false breakouts or sudden reversals. Start by applying it to your favorite crypto chart today, and let the trend guide your decisions.