
Mastering the Market’s Secret Language: A Beginner’s Guide to Japanese Candlestick Patterns
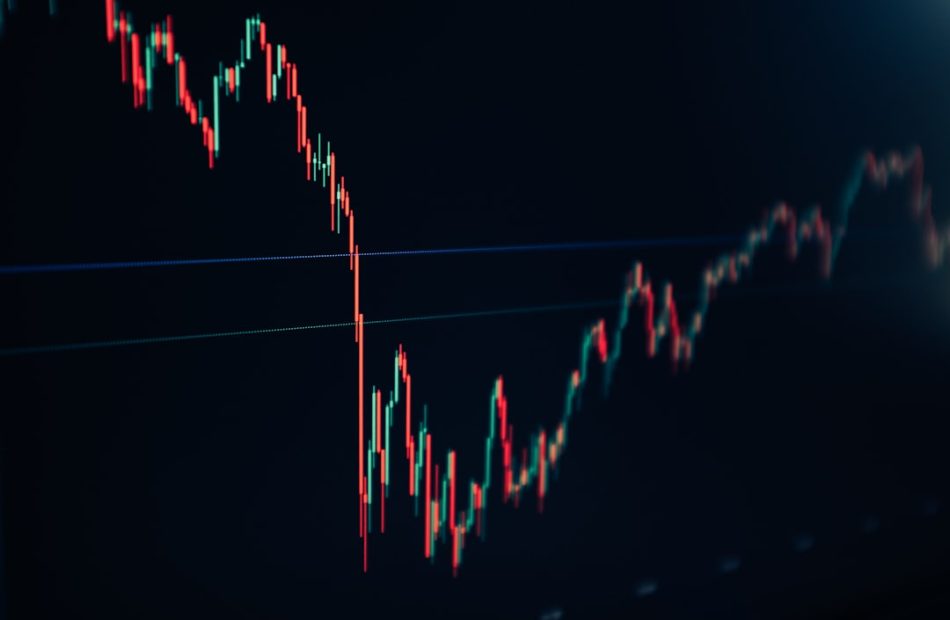
Have you ever looked at a price chart and felt like you were staring at a foreign language? Bars, lines, and zigzags can feel overwhelming—but there’s one tool that turns that noise into a clear story: Japanese candlestick patterns. These ancient formations, used by rice traders in 18th-century Japan, are still the most intuitive way to read market sentiment. Once you understand them, you’ll start seeing buying pressure, selling exhaustion, and potential reversals as clearly as a red light or green light.
How It Works
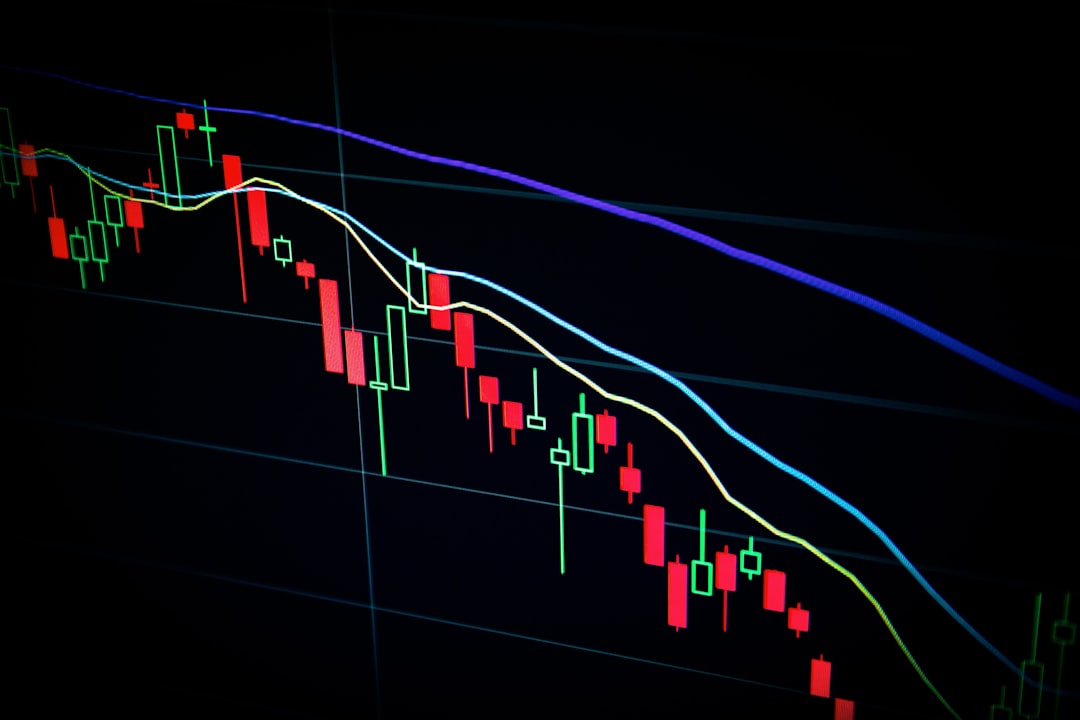
Each candlestick represents a specific time period (like 1 hour or 1 day). The “body” shows the opening and closing price, while the “wicks” (or shadows) show the high and low. When the close is higher than the open, the body is typically green or white—indicating buyers are in control. When the close is lower, the body is red or black—sellers are in charge. But the real magic happens when you spot patterns formed by two or three candles.
The Setup
Let’s break down three essential patterns every beginner should know:
1. The Hammer (Bullish Reversal)
- Appearance: A single candle with a small body at the top and a long lower wick (at least twice the body length).
- What it tells you: Sellers pushed the price down during the session, but buyers stepped in and drove it back up near the opening. This shows strong buying support at lower levels.
- When to use it: After a downtrend. The longer the wick, the stronger the signal.
2. The Shooting Star (Bearish Reversal)
- Appearance: A single candle with a small body at the bottom and a long upper wick.
- What it tells you: Buyers pushed the price high, but sellers took over and forced it back down. This indicates selling pressure at higher prices.
- When to use it: After an uptrend. Look for confirmation with a red candle the next day.
3. The Engulfing Pattern (Strong Reversal)
- Appearance: Two candles. The second candle’s body completely “engulfs” the first candle’s body.
- Bullish Engulfing: A red (or black) candle is followed by a larger green candle that covers it. This signals a shift from selling to buying.
- Bearish Engulfing: A green candle is followed by a larger red candle that covers it. This signals a shift from buying to selling.
- When to use it: At the end of a trend. The bigger the second candle, the more reliable the pattern.
Risk Management
No pattern is 100% accurate. Even the most classic hammer can fail if the overall trend is too strong. Here’s how to protect yourself:
- Always wait for confirmation: Don’t enter a trade as soon as you see a pattern. Wait for the next candle to close in the expected direction.
- Use stop-losses: Place your stop-loss below the low of a hammer (for a buy) or above the high of a shooting star (for a sell). This limits your loss if the pattern fails.
- Combine with support/resistance: A hammer at a known support level is far more powerful than one in the middle of nowhere. Similarly, a shooting star at resistance is a stronger signal.
- Risk only 1-2% of your account per trade. Candlestick patterns help you enter, but risk management keeps you in the game.
Conclusion
Japanese candlestick patterns turn raw price data into a visual story of fear, greed, and opportunity. Start by practicing on a demo account: look for hammers after drops, shooting stars after rallies, and engulfing patterns at key levels. Over time, you’ll develop an intuition for market psychology that no indicator can replace. Remember, these patterns are tools—not guarantees. Use them with patience, discipline, and solid risk management, and you’ll trade with the confidence of a seasoned pro.