
Master the RSI Divergence Strategy: Spot Trend Reversals Before They Happen
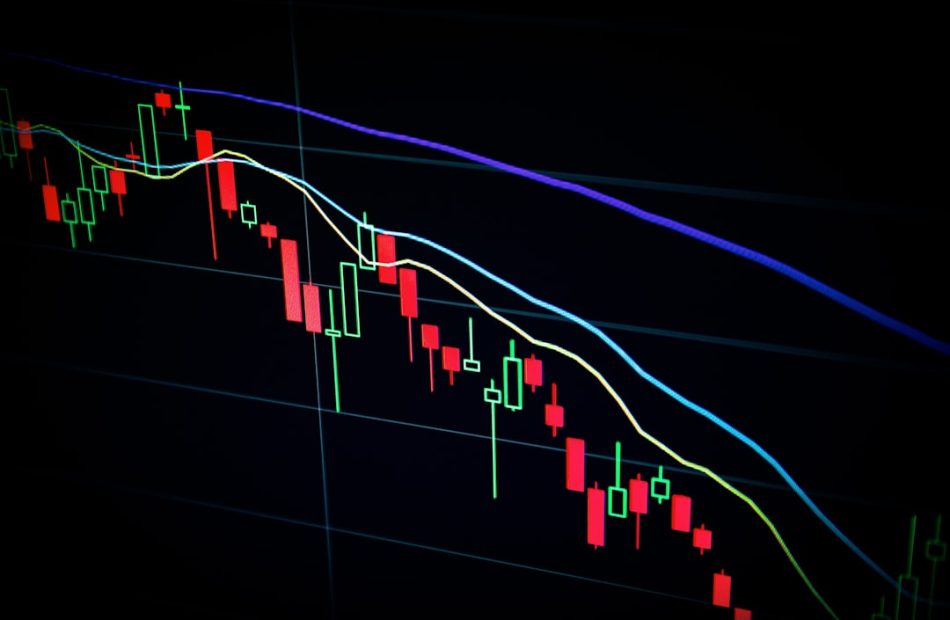
Have you ever watched a coin pump to new highs, only to crash moments after you FOMO’d in? Or seen a token hit a lower low, then suddenly explode upward? These moments are often preceded by a subtle but powerful signal called RSI divergence. It’s one of the most reliable tools for catching trend reversals early—and today, I’m going to show you exactly how to use it.
How It Works
The Relative Strength Index (RSI) is a momentum oscillator that measures the speed and change of price movements. Normally, RSI moves in the same direction as price. But when they disagree, that’s divergence.
There are two types:
- Bullish Divergence: Price makes a lower low, but RSI makes a higher low. This suggests selling momentum is fading, and a reversal to the upside is likely.
- Bearish Divergence: Price makes a higher high, but RSI makes a lower high. This hints that buying momentum is weakening, and a drop may follow.
The Setup
Here’s a step-by-step process to spot and trade RSI divergence:

1. Identify the trend – Look for a clear uptrend (for bearish divergence) or downtrend (for bullish divergence) on the 1-hour or 4-hour chart.
2. Wait for a swing high or low – Mark the most recent price peak (for bearish) or trough (for bullish).
3. Check the RSI – Compare that peak/trough to the previous one. RSI should show a lower high (bearish) or higher low (bullish).
4. Confirm with price action – Wait for a break of the nearest trendline or a candlestick reversal pattern (like a pin bar or engulfing candle).
5. Enter the trade – Go long on bullish divergence, short on bearish divergence.
Pro Tip: Use a 14-period RSI with standard settings. Divergence on higher timeframes (4H, daily) is more reliable than on lower ones (5min, 15min).
Risk Management
No strategy is perfect—divergence can sometimes fail. Protect your capital with these rules:
- Stop-loss: Place it just beyond the most recent swing low (for longs) or swing high (for shorts).
- Position size: Risk no more than 1–2% of your account per trade.
- Take-profit: Aim for the next key support/resistance level, or use a 2:1 risk-to-reward ratio.
- Avoid catching falling knives: Wait for confirmation. A divergence alone is not a signal—price must show intent.
Conclusion
RSI divergence is like a whisper from the market, telling you that the current trend is running out of steam. By learning to spot it, you can enter trades early, ride powerful reversals, and avoid getting caught on the wrong side of a move. Practice on historical charts first, then paper trade until it becomes second nature. Remember: patience and discipline are your best friends. Happy trading!