
Ethereum vs Solana Ratio Trading: A Modern Crypto Strategy

The crypto market is rarely a monolithic entity. While Bitcoin dominance ebbs and flows, the real action for traders often lies in the relative performance of Layer 1 blockchains. Two titans dominate this conversation: Ethereum (ETH), the established king of smart contracts, and Solana (SOL), the high-speed challenger. Trading their ratio isn’t just about picking a winner—it’s a sophisticated way to profit from market rotation, manage risk, and capture alpha without betting on the direction of the broader market.
How It Works
Ratio trading involves taking a position on the relative strength of one asset versus another. Instead of asking “Will ETH go up?” you ask “Will ETH outperform SOL?” or vice versa. You execute this by simultaneously opening a long position in one asset and a short position in the other, creating a market-neutral pair trade. The profit or loss depends entirely on the changing ratio between the two prices.
The Setup
To trade the ETH/SOL ratio, you need a crypto exchange that allows spot margin or futures trading on both assets. Here’s a step-by-step setup:
Looking for altcoin opportunities and smooth trading? Try KuCoin.
1. Choose Your Direction: Determine which asset is likely to outperform. For example, if you believe ETH is undervalued relative to SOL, you go long ETH and short SOL.
2. Calculate the Ratio: Check the current ETH price vs SOL price (e.g., 1 ETH = 15 SOL). This is your entry ratio.
3. Open the Pair Trade: Open a long position in ETH and a short position in SOL with equal notional value (e.g., $10,000 in each).
4. Monitor the Ratio: If ETH rallies relative to SOL, the ratio increases (e.g., 1 ETH = 18 SOL). You profit from the difference.
5. Exit When the Ratio Reverses or Hits Your Target: Close both positions simultaneously to lock in the ratio change.
Key Indicators to Watch
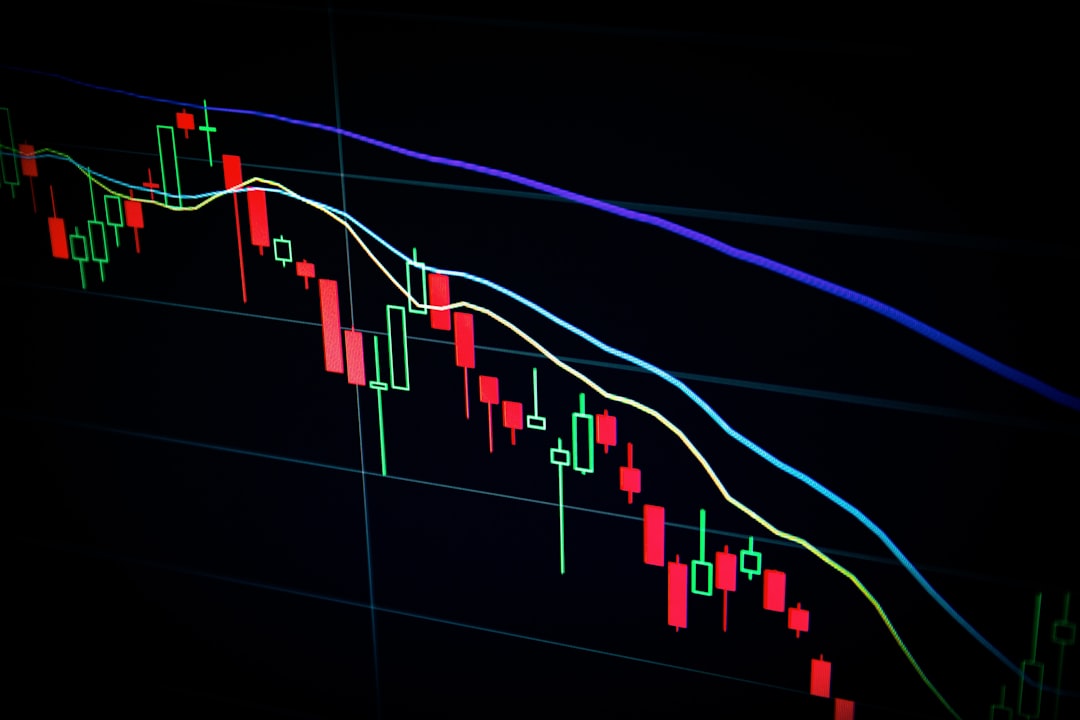
- Relative Strength Index (RSI): Use the RSI on the ratio chart (ETH/SOL price pair on TradingView). Oversold (70) suggests the opposite.
- Moving Averages: The 50-day and 200-day MA on the ratio chart can signal trend shifts. A cross above the 200-day MA is bullish for ETH relative to SOL.
- Narrative Shifts: News about Ethereum upgrades (e.g., Dencun) or Solana network outages often trigger sharp ratio movements.
- Volume Spikes: Unusual volume on the ratio pair can indicate institutional rotation.
Risk Management
Pair trading is not risk-free. Here’s how to protect your capital:
- Use Stop-Losses on the Ratio: Set a stop-loss at a specific ratio level (e.g., 5% move against you). This avoids the need to monitor both positions separately.
- Equal Notional Exposure: Always ensure the dollar value of your long and short positions are equal at entry to remain market-neutral.
- Beware of Funding Rates: If you use perpetual futures, funding rates can eat into profits. Check that the rates are not heavily skewed against your position.
- Slippage and Liquidity: ETH and SOL are highly liquid, but during extreme volatility, spreads can widen. Use limit orders.
- Correlation Risk: If the entire market crashes (e.g., a black swan event), both assets may fall together, but the ratio may remain stable. Your stop-loss on the ratio will protect you.
Conclusion
Ethereum vs Solana ratio trading is a powerful addition to any intermediate trader’s toolkit. It allows you to profit from the ongoing Layer 1 competition while hedging against broad market volatility. Start small, practice on a testnet or with minimal capital, and track the ratio chart daily. As you gain confidence, you’ll see that mastering this strategy can turn market noise into consistent opportunity.