
Mastering the Fibonacci Retracement Entry: A Simple Strategy for Precision Trading

Have you ever watched a market pull back and wondered, “Is this a dip worth buying, or the start of a deeper crash?” If you’ve been trading for a while, you know that feeling of hesitation. The difference between a profitable trade and a losing one often comes down to timing. That’s where the Fibonacci retracement entry shines. It’s a tool that helps you identify high-probability entry points during a pullback, giving you confidence to act when others are frozen.
Today, we’re going to break down a simple, actionable strategy that uses Fibonacci retracement levels to catch the next move in a trend. No complex math, no confusing jargon—just a clear plan you can use right away.
How It Works
Fibonacci retracement is based on the idea that markets often retrace a predictable portion of a move before continuing in the original direction. The key levels are 23.6%, 38.2%, 50%, 61.8%, and 78.6%. In trending markets, the 38.2% and 61.8% levels are the most reliable for entries. Think of them as natural support or resistance zones where buyers or sellers step in.
The Setup
To apply this strategy, follow these steps:
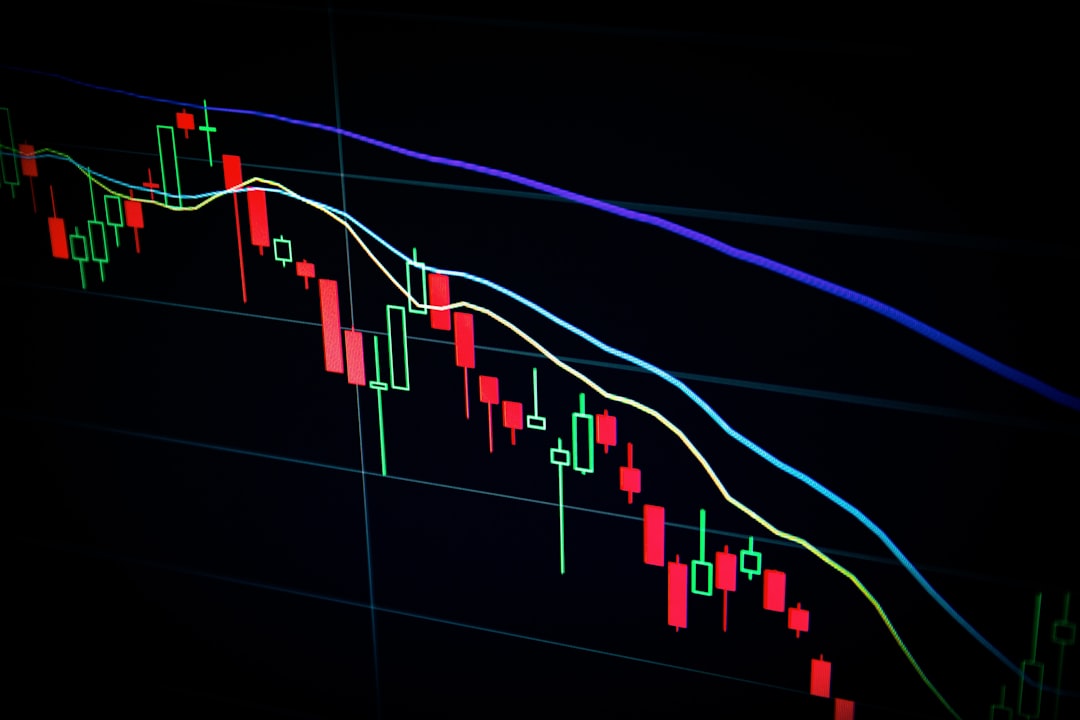
1. Identify a strong trend. Look for a clear uptrend (higher highs and higher lows) or downtrend (lower highs and lower lows). Use a simple moving average (e.g., 50-period) to confirm the trend direction.
2. Draw the Fibonacci tool. On your chart, click the Fibonacci retracement tool. For an uptrend, drag from the swing low (bottom) to the swing high (top). For a downtrend, drag from the swing high to the swing low.
3. Wait for the pullback. As price retraces, watch the 38.2% and 61.8% levels. These are your potential entry zones.
4. Look for confirmation. Don’t just buy because price touches a level. Wait for a bullish candlestick pattern (like a hammer or engulfing candle) or a bounce off the level. This reduces false signals.
5. Enter the trade. Place your buy order (in an uptrend) or sell order (in a downtrend) once the confirmation candle closes. Set your stop loss just below the next Fibonacci level (e.g., below the 78.6% level) or below the recent swing low.
Risk Management
No strategy works 100% of the time, so protecting your capital is crucial. Here’s how to manage risk with this setup:
- Position size: Risk no more than 1-2% of your account on any single trade. Calculate your position size based on the distance from entry to stop loss.
- Stop loss placement: Place your stop loss below the 78.6% level (for uptrends) or above it (for downtrends). This gives the trade room to breathe while limiting losses if the retracement deepens.
- Take profit targets: Use the next Fibonacci extension levels (127.2%, 161.8%) or a risk-reward ratio of at least 1:2. For example, if your stop loss is 2% away, aim for a profit of 4% or more.
- Avoid trading during news: Major economic announcements can cause erratic price movements that break Fibonacci levels. Stick to quieter market hours for higher reliability.
Conclusion
Fibonacci retracement entries are a powerful tool to add to your trading arsenal. They help you buy low in an uptrend and sell high in a downtrend, turning pullbacks into opportunities. Remember, the key is patience—wait for the level and the confirmation before pulling the trigger. Start practicing on a demo account, and soon you’ll see how this simple strategy can improve your timing and confidence. Happy trading!