
Mastering the Market’s Language: A Beginner’s Guide to Japanese Candlestick Patterns
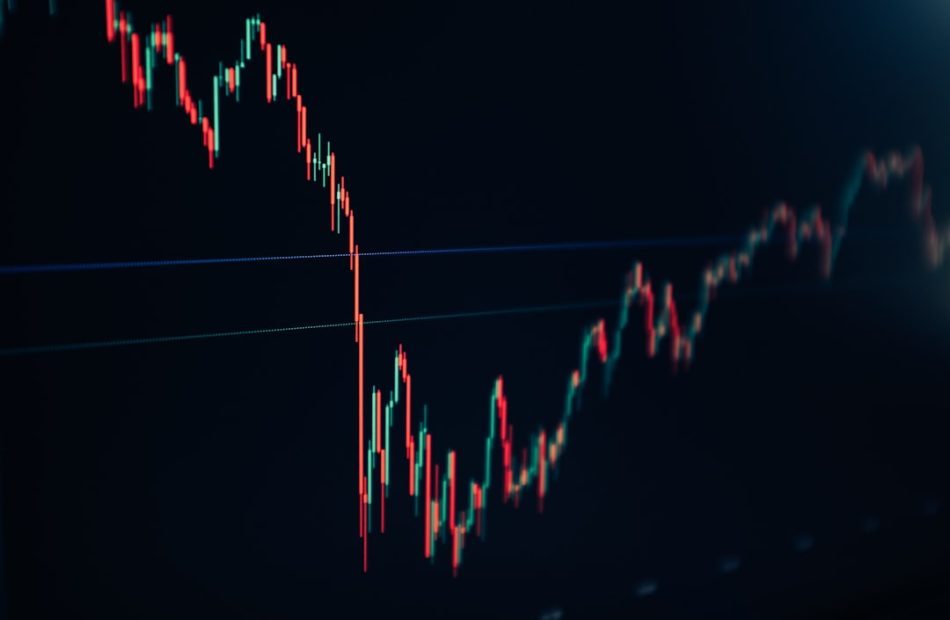
Ever looked at a chart and felt like you were staring at a secret code? Those flickering rectangles with wicks aren’t just random shapes—they’re the market’s way of telling a story. In this guide, we’ll decode that story using one of the oldest and most powerful tools in a trader’s arsenal: Japanese candlestick patterns. Whether you’re just starting out or looking to sharpen your skills, understanding these patterns can give you a serious edge in reading price action and making smarter trading decisions.
How It Works
Japanese candlesticks date back to 18th-century rice trading in Japan, where a clever trader named Munehisa Homma developed a way to visualize price movements and market emotion. Today, they’re the universal language of charts, and for good reason. Each candlestick provides a wealth of information at a glance: the open, high, low, and close of an asset over a specific time period. But more than that, the shape and color of each candle reveal the battle between buyers (bulls) and sellers (bears).
A green (or white) candle means the price closed higher than it opened—bulls won that round. A red (or black) candle means the price closed lower—bears took control. The wicks (or shadows) show the range of price during the period, giving you clues about rejection and momentum. When you group these candles into recognizable patterns, you start to see potential reversals, continuations, and moments of indecision before they happen.
The Setup
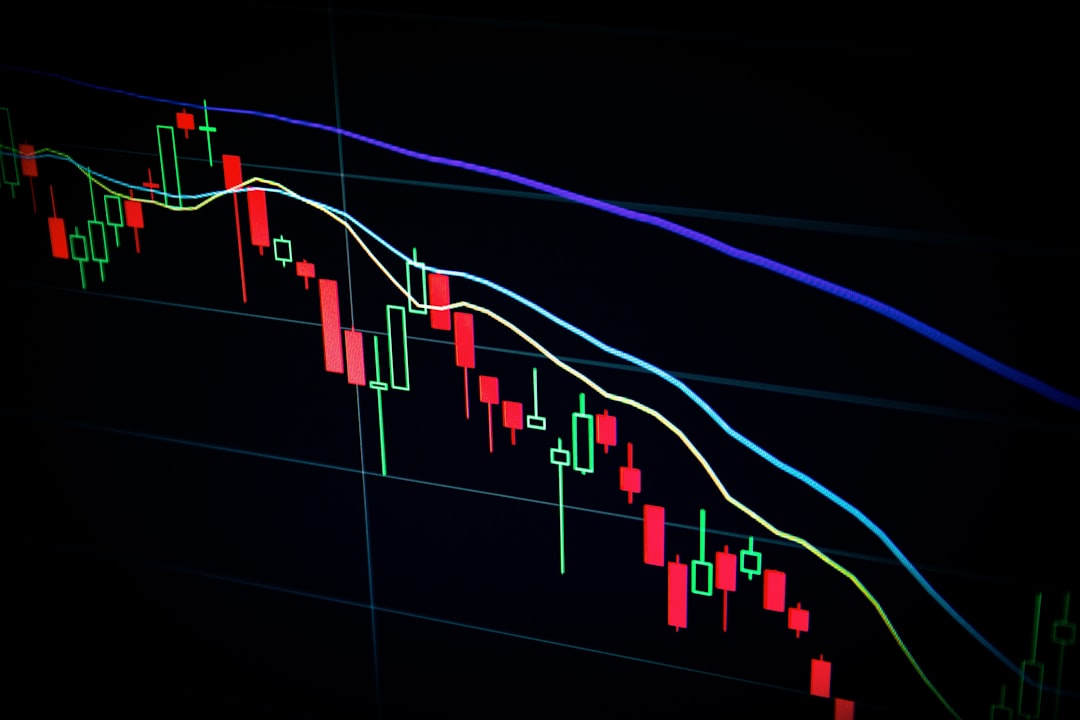
Now, let’s dive into some of the most reliable and beginner-friendly candlestick patterns. Remember, these are not magic signals—they’re clues that need confirmation. Here are the classic setups you should know:
1. The Hammer and the Hanging Man
- Hammer: Appears at the bottom of a downtrend. It has a small real body at the top and a long lower wick (at least twice the body’s length). This signals that sellers pushed the price down, but buyers stepped in and pushed it back up—a potential reversal to the upside.
- Hanging Man: Looks identical to the hammer, but it appears at the top of an uptrend. It warns that the bulls are losing control, and a bearish reversal could be coming.
2. The Bullish and Bearish Engulfing
- Bullish Engulfing: A small red candle is followed by a large green candle that completely ‘engulfs’ the previous candle’s body. This shows a strong shift in momentum from selling to buying—a classic reversal signal at a support level.
- Bearish Engulfing: The opposite—a small green candle is followed by a large red candle that engulfs it. This signals that sellers have taken over, often appearing at resistance levels.
3. The Doji
- A doji has a very small real body, with open and close nearly equal. It represents indecision in the market—neither bulls nor bears could gain control. When a doji appears after a strong trend, it can signal a potential reversal, but it’s crucial to wait for confirmation from the next candle before acting.
4. The Morning Star and Evening Star
- Morning Star: A three-candle pattern at the bottom of a downtrend: a long red candle, a small-bodied candle (doji or small real body), and then a long green candle that closes well into the first candle’s body. This is a strong bullish reversal signal.
- Evening Star: The mirror image at the top of an uptrend: a long green candle, a small candle, and then a long red candle that closes deep into the first. This suggests a bearish reversal.
5. The Shooting Star and the Inverted Hammer
- Shooting Star: Appears at the top of an uptrend with a small lower body and a long upper wick. It shows that buyers pushed price up, but sellers drove it back down—a bearish reversal signal.
- Inverted Hammer: Looks like a shooting star but appears at the bottom of a downtrend. It suggests that buyers are starting to test the upside, and a reversal may be on the horizon.
Putting It All Together
To use these patterns effectively, you need to look for them in the right context. A hammer at a major support level is far more meaningful than one in the middle of nowhere. Always combine candlestick patterns with other technical tools like trendlines, moving averages, or support/resistance zones. And never trade a pattern in isolation—wait for the next candle to confirm the reversal (e.g., a green candle after a hammer, or a red candle after a shooting star).
Risk Management
Even the best candlestick pattern can fail. That’s why risk management is non-negotiable. Here’s how to protect yourself while trading these setups:
- Set a Stop-Loss: Always place a stop-loss below the pattern’s low (for bullish setups) or above the pattern’s high (for bearish setups). This limits your loss if the market goes against you.
- Use Proper Position Sizing: Never risk more than 1-2% of your trading capital on a single trade. This ensures that a string of losses won’t wipe out your account.
- Wait for Confirmation: Don’t jump in at the first sign of a pattern. Wait for the next candle to confirm the reversal. This reduces false signals.
- Be Aware of Market Context: Patterns work best at key levels, not in the middle of a range. If you’re unsure, skip the trade.
- Practice First: Use a demo account to test your understanding of these patterns before risking real money. Track your results and refine your approach.
Conclusion
Japanese candlestick patterns are like the market’s heartbeat—they show you the rhythm of buying and selling pressure. By learning to recognize these patterns, you’re not just reading charts; you’re reading the psychology of every trader in the market. Start by mastering the basics we’ve covered, practice on historical charts, and always combine your analysis with solid risk management. Remember, no single pattern is a golden ticket, but with time and practice, you’ll develop an intuition that can significantly improve your trading. So, open your chart, spot a hammer, and take your first step toward becoming a more confident trader. Happy trading, and stay curious!
Disclaimer: Trading involves risk. Always do your own research and consider seeking advice from a financial advisor.