
Mastering Japanese Candlestick Patterns: The Trader’s Secret Language
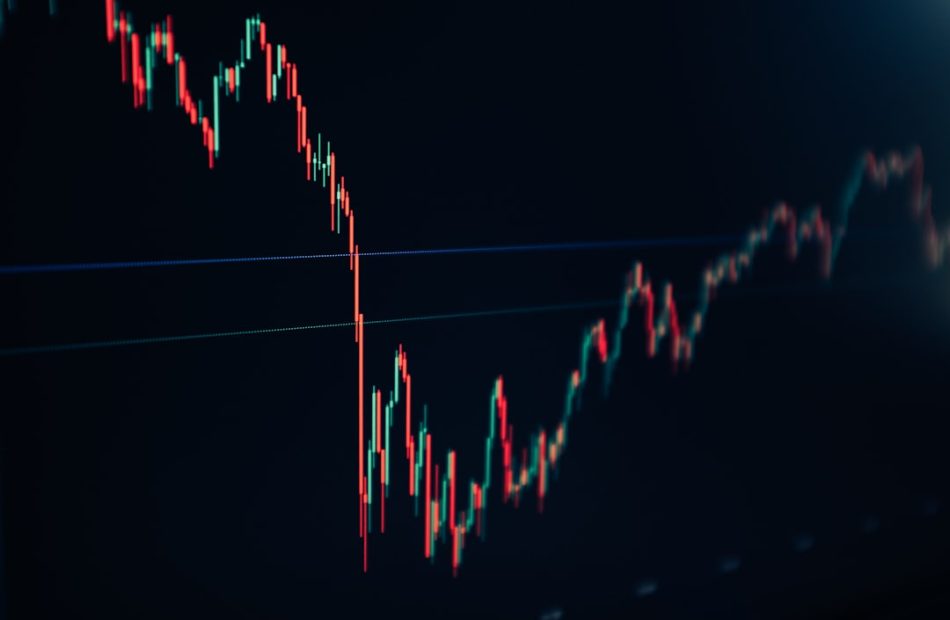
Imagine being able to look at a price chart and instantly understand the battle between buyers and sellers. That’s the power of Japanese candlestick patterns. These ancient visual tools, developed by rice traders in 18th-century Japan, are now the backbone of modern technical analysis. They tell a story of market sentiment, momentum, and potential reversals—all in a single glance. If you’re new to trading or just looking to sharpen your skills, mastering candlestick patterns is like learning a new language—the language of the market. Let’s dive in and decode it together.
How It Works
At its core, a candlestick represents price action over a specific time period (e.g., 1 minute, 1 hour, 1 day). Each candle has four key components: open, high, low, and close. The body shows the range between open and close, while the wicks (or shadows) show the high and low. The color tells you if the close was higher (bullish, usually green) or lower (bearish, usually red) than the open.
But the real magic lies in the patterns these candles form. These patterns reveal the psychological state of the market—whether buyers are in control, sellers are dominating, or indecision is brewing. By recognizing these patterns, you can anticipate potential price movements and make smarter trading decisions.
Looking for altcoin opportunities and smooth trading? Try KuCoin.
The Setup
Let’s explore the most essential candlestick patterns every trader should know. We’ll start with single-candle patterns, then move to two-candle and three-candle formations.
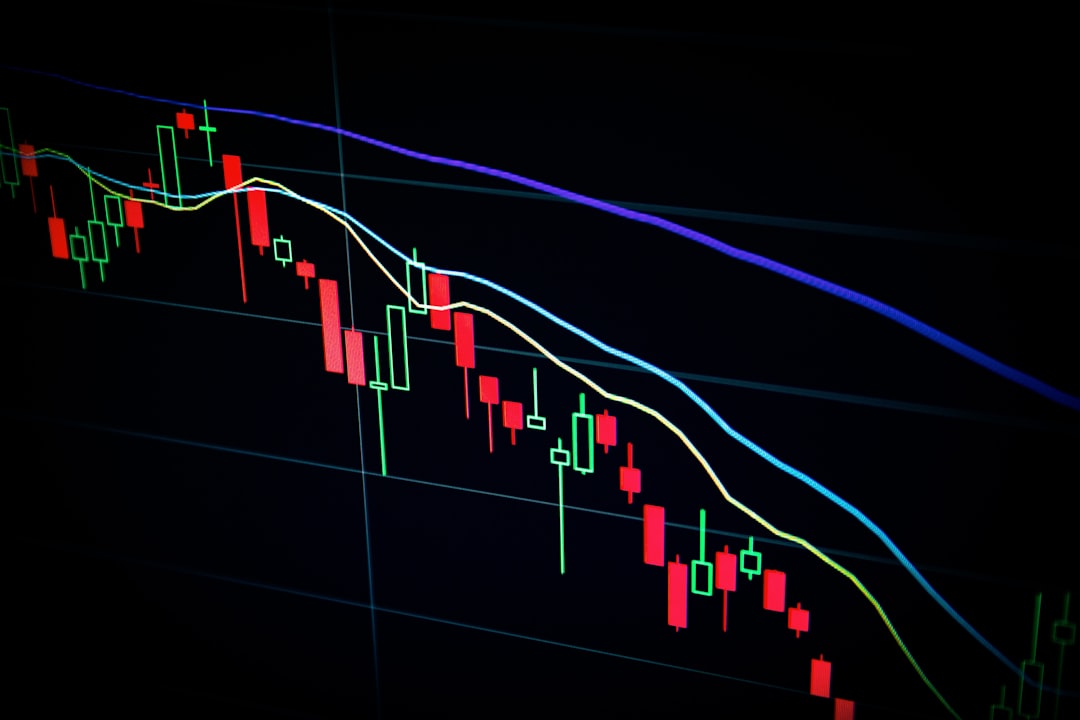
Single-Candle Patterns
- Doji: When open and close are nearly equal, the body becomes tiny or nonexistent. This signals indecision—neither buyers nor sellers have taken control. A doji after a strong uptrend or downtrend often hints at a potential reversal.
- Hammer: A small body at the top with a long lower wick. It appears during a downtrend and suggests that sellers pushed prices down, but buyers fought back and closed near the open. This is a bullish reversal signal.
- Shooting Star: The opposite of a hammer—a small body at the bottom with a long upper wick. Appearing after an uptrend, it signals that buyers tried to push higher but sellers overwhelmed them. This is a bearish reversal signal.
Two-Candle Patterns
- Bullish Engulfing: A small bearish candle followed by a large bullish candle that ‘engulfs’ the previous body. This shows buyers taking control after a period of selling—a strong bullish reversal signal.
- Bearish Engulfing: The reverse—a small bullish candle followed by a large bearish candle that engulfs it. This indicates sellers overpowering buyers, often leading to a downtrend.
Three-Candle Patterns
- Morning Star: A three-candle pattern at the bottom of a downtrend: a large bearish candle, a small-bodied candle (doji or hammer), and then a large bullish candle. It signals a strong reversal to the upside.
- Evening Star: The top-of-trend counterpart—a large bullish candle, a small-bodied candle, and then a large bearish candle. It signals a reversal to the downside.
Putting It Together
Patterns are most reliable when they occur at key support or resistance levels, or after a clear trend. For example, a bullish engulfing pattern at a strong support level is a much stronger signal than one in the middle of a range. Always combine patterns with other indicators like volume, moving averages, or RSI to confirm your bias.
Risk Management
Even the best candlestick patterns can fail. That’s why risk management is non-negotiable. Here are three golden rules:
1. Use a Stop-Loss: Always set a stop-loss just beyond the pattern’s extreme. For a bullish engulfing, place it below the low of the pattern. For a bearish engulfing, place it above the high. This limits your loss if the market reverses.
2. Position Sizing: Never risk more than 1-2% of your trading capital on a single trade. This ensures that a string of losses won’t wipe out your account.
3. Confirm with the Trend: Trade in the direction of the larger trend. If the daily chart is bullish, look for bullish candlestick patterns on the 4-hour or 1-hour chart. This ‘higher-timeframe confluence’ increases your win rate significantly.
Conclusion
Japanese candlestick patterns are a powerful tool in any trader’s arsenal. They offer a visual, intuitive way to read market sentiment and spot potential reversals. But remember, no pattern works 100% of the time. Always use them in context, combine with other analysis, and manage your risk diligently. As you practice, you’ll develop an eye for these patterns and start seeing the market in a whole new light. So go ahead—open your chart, spot a hammer or a doji, and make your next trade with confidence. Happy trading!