
The Golden Cross: A Timeless Signal for Riding Bullish Waves

Have you ever looked at a price chart and felt a surge of excitement when a fast-moving line crosses above a slower one? That, my friend, is the Golden Cross—one of the most recognized and respected signals in technical analysis. It’s not a crystal ball, but it’s a powerful tool that can help you align with the market’s momentum and potentially catch significant upward trends. In this post, we’ll break down what the Golden Cross is, how to trade it effectively, and—most importantly—how to manage the risks that come with any trading strategy.
How It Works
The Golden Cross is a bullish signal that occurs when a short-term moving average crosses above a long-term moving average. Typically, traders use the 50-day and 200-day moving averages, but you can adjust these periods to suit your trading style. The idea is simple: when the 50-day MA (the faster line) moves above the 200-day MA (the slower line), it suggests that recent price action is gaining strength relative to the longer-term trend. This crossover often marks the beginning of a sustained uptrend, as buyers take control and push prices higher.
The Setup
To spot a Golden Cross, you need a chart with the 50-day and 200-day moving averages plotted. Here’s how to set it up:
1. Open your favorite charting platform (TradingView, MetaTrader, etc.).
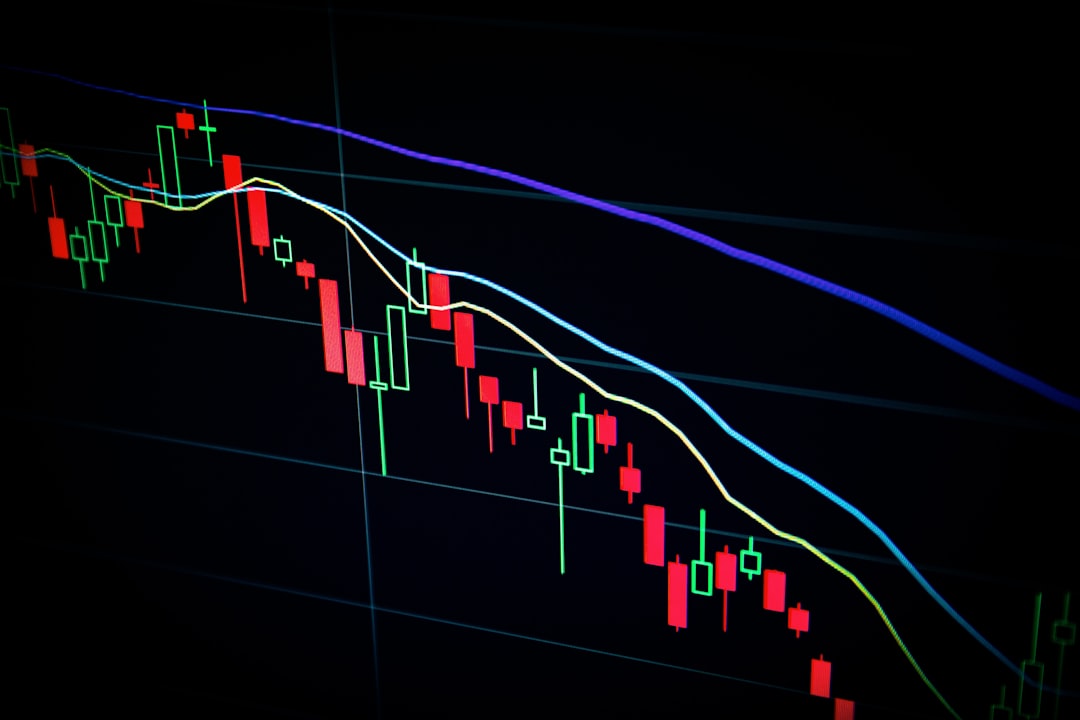
2. Add two moving averages – one with a period of 50 and another with a period of 200. Use simple moving averages (SMA) for clarity.
3. Look for the crossover – when the 50 SMA crosses above the 200 SMA, that’s your Golden Cross. The signal is stronger if it happens after a period of consolidation or a downtrend, as it indicates a potential reversal.
4. Confirm with volume – a Golden Cross accompanied by increasing trading volume adds credibility to the signal. Higher volume suggests strong participation from buyers.
Remember, the Golden Cross is a lagging indicator—it tells you what has already happened. So, it’s best used in conjunction with other tools like support/resistance levels or momentum oscillators to increase your odds.
Risk Management
No signal is perfect, and the Golden Cross can produce false signals, especially in choppy or sideways markets. That’s why risk management is your best friend. Here are some golden rules:
- Set a stop-loss – Place a stop-loss order below the 200-day moving average or below a recent swing low. This limits your downside if the trade goes against you.
- Position sizing – Never risk more than 1-2% of your trading capital on a single trade. This ensures that a few losses won’t wipe out your account.
- Be patient – Wait for the crossover to happen and maybe even wait for a pullback to the moving average before entering. This gives you a better entry price and reduces the chance of buying at a peak.
- Have an exit plan – Decide in advance when you’ll take profits. Some traders exit when the 50 MA crosses below the 200 MA (the Death Cross), while others use a trailing stop to lock in gains as the trend progresses.
Conclusion
The Golden Cross is a classic signal that has stood the test of time. It’s simple to understand, easy to spot, and can be a valuable addition to your trading toolkit. But remember, it’s not a guarantee—it’s a probability. Use it alongside sound risk management and a solid trading plan. As with any strategy, practice on a demo account first, and never risk more than you can afford to lose. The markets are always moving, and the Golden Cross can help you ride the bullish waves with confidence. Happy trading!