
Mastering the Ichimoku Cloud: A Beginner’s Guide to Trading with Confidence

Imagine having a single indicator that reveals trend direction, momentum, support and resistance, and even future price levels—all at a glance. That’s the power of the Ichimoku Cloud. Developed in the 1930s by Japanese journalist Goichi Hosoda, this comprehensive system has stood the test of time and remains one of the most versatile tools in a trader’s arsenal. While its five lines and shaded cloud may look intimidating at first, once you understand the basics, you’ll wonder how you ever traded without it. In this guide, we’ll break down the Ichimoku Cloud into simple, actionable steps so you can start using it to make more informed trading decisions today.
How It Works
The Ichimoku Cloud (or Ichimoku Kinko Hyo, meaning ‘one glance equilibrium chart’) consists of five key components. Each one provides unique information, but together they form a cohesive system. Here’s what each part tells you:
- Tenkan-sen (Conversion Line): The average of the highest high and lowest low over the last 9 periods. It acts as a short-term momentum indicator and a quick support/resistance level.
- Kijun-sen (Base Line): The average of the highest high and lowest low over the last 26 periods. It represents medium-term trend direction and is often used as a trailing stop.
- Senkou Span A (Leading Span A): The average of the Tenkan-sen and Kijun-sen, plotted 26 periods ahead. This forms one edge of the cloud.
- Senkou Span B (Leading Span B): The average of the highest high and lowest low over the last 52 periods, also plotted 26 periods ahead. This forms the other edge of the cloud.
- Chikou Span (Lagging Span): The current closing price plotted 26 periods in the past. It helps confirm trend strength and potential reversals.
The cloud itself is the shaded area between Senkou Span A and B. It represents a dynamic support and resistance zone, and its thickness indicates price volatility. The color of the cloud (green when Span A > Span B, red when Span B > Span A) shows whether the market is bullish or bearish.
Looking for altcoin opportunities and smooth trading? Try KuCoin.
The Setup
Now, let’s put this into practice. Here’s a step-by-step strategy for using the Ichimoku Cloud to identify high-probability trades:
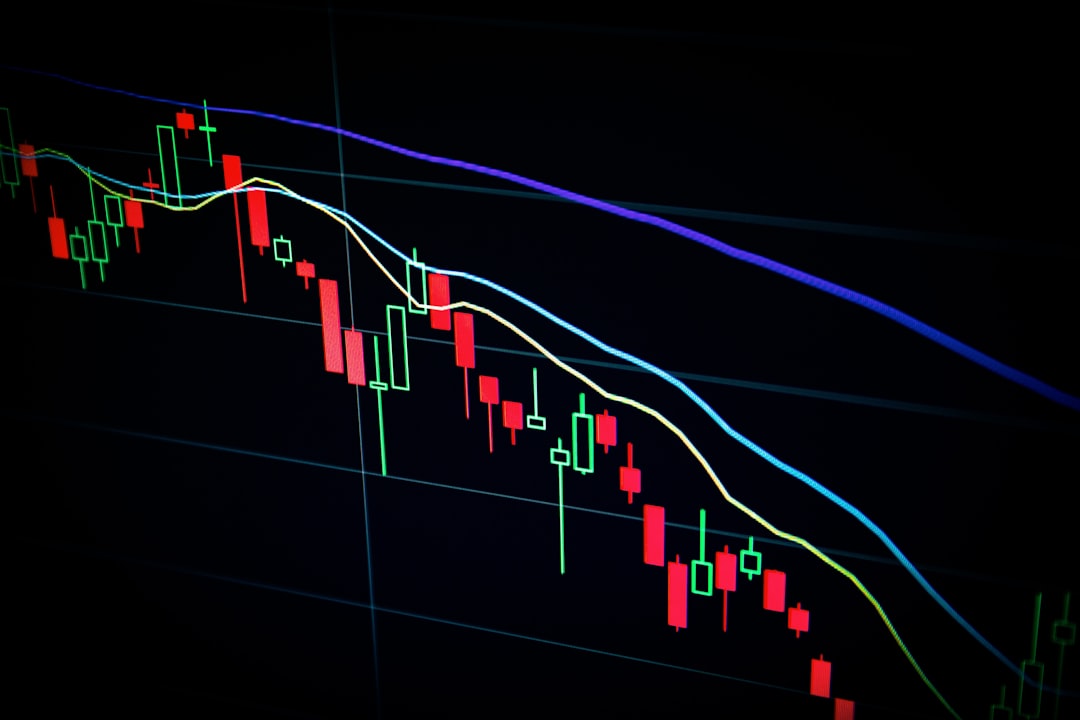
1. Identify the Trend: Start by looking at the cloud. If price is above the cloud, the overall trend is bullish. If price is below the cloud, the trend is bearish. If price is inside the cloud, the market is ranging or transitioning.
2. Confirm with the Cross: Wait for a strong signal. A classic bullish signal occurs when the Tenkan-sen crosses above the Kijun-sen (a golden cross) while price is above the cloud. Conversely, a bearish signal is a cross below the Kijun-sen while price is below the cloud. The more decisive the cross, the stronger the signal.
3. Check the Lagging Span: For added confirmation, look at the Chikou Span. If it is above price, it confirms bullish momentum; if below, it confirms bearish pressure. A rising Chikou Span that remains above price strengthens a buy signal, while a falling Chikou Span below price supports a sell signal.
4. Enter with the Cloud as Support/Resistance: For a long trade, wait for price to pull back to the cloud and bounce off it. This is your entry zone. For a short, wait for a rally into the cloud that gets rejected. The cloud acts as a dynamic floor or ceiling, giving you a clear area to place your entry.
5. Set Your Targets: Use the Kijun-sen as a trailing stop, and consider taking profits when price moves far from the cloud. Alternatively, use the Senkou Span B as a target if price is trending strongly. Many traders also use the cloud’s other side as a target for mean reversion trades.
Risk Management
No strategy is complete without solid risk management, and the Ichimoku Cloud offers excellent tools to protect your capital:
- Stop-Loss Placement: Always place your stop-loss below the cloud (for longs) or above the cloud (for shorts). If price closes beyond the cloud, it signals a potential trend reversal, and you should exit immediately. The cloud’s edge serves as a natural stop level.
- Position Sizing: The cloud’s thickness can guide your position size. A thick cloud indicates high volatility and wide stops, so reduce your position size accordingly. A thin cloud suggests tighter stops, allowing for a larger position.
- Avoid the Chop: When price is inside the cloud, the market is indecisive. Avoid taking new trades during this period, as signals are unreliable. Wait for a clear breakout above or below the cloud.
- Use Multi-Timeframe Analysis: Always check the higher timeframe to ensure your trade aligns with the bigger trend. For example, if the daily cloud is bullish, look for long setups on the 1-hour or 4-hour charts.
- Keep It Simple: Don’t overload your chart with other indicators. The Ichimoku Cloud is a complete system. If you must add anything, use volume or a simple moving average to filter false signals.
Conclusion
The Ichimoku Cloud is a powerful, all-in-one indicator that can transform your trading. By understanding its five components and learning to read the cloud, you gain a clear edge in identifying trends, finding entry points, and managing risk. Remember, like any skill, mastering the Ichimoku takes practice. Start by applying it to a demo account, observe how it behaves in different market conditions, and gradually integrate it into your trading routine. With patience and discipline, you’ll soon be reading the clouds with confidence—and making smarter trading decisions along the way. Happy trading!