
The Golden Cross: A Beginner’s Guide to This Classic Bullish Signal

Have you ever looked at a price chart and noticed two lines crossing, seemingly signaling a major market move? That, my friend, is the Golden Cross—one of the most talked-about technical patterns in trading. It’s a simple yet powerful signal that can help you spot potential uptrends early. In this guide, we’ll break down what it is, how to spot it, and how to trade it without getting burned. Let’s dive in!
How It Works
The Golden Cross is a bullish crossover that occurs when a short-term moving average (MA) crosses above a long-term moving average. The most common pair is the 50-day MA (short-term) and the 200-day MA (long-term). When the 50-day MA rises above the 200-day MA, it signals that recent price momentum is shifting upward, suggesting a possible long-term trend reversal from bearish to bullish.
Think of it as a ‘thumbs up’ from the market’s moving averages. It’s not a guarantee of future gains, but it’s a strong hint that buyers are stepping in and the trend may be turning in your favor.
The Setup
To trade the Golden Cross, follow these steps:
1. Identify the MAs: Plot the 50-day and 200-day simple moving averages (SMAs) on your chart. Most trading platforms have these built-in.
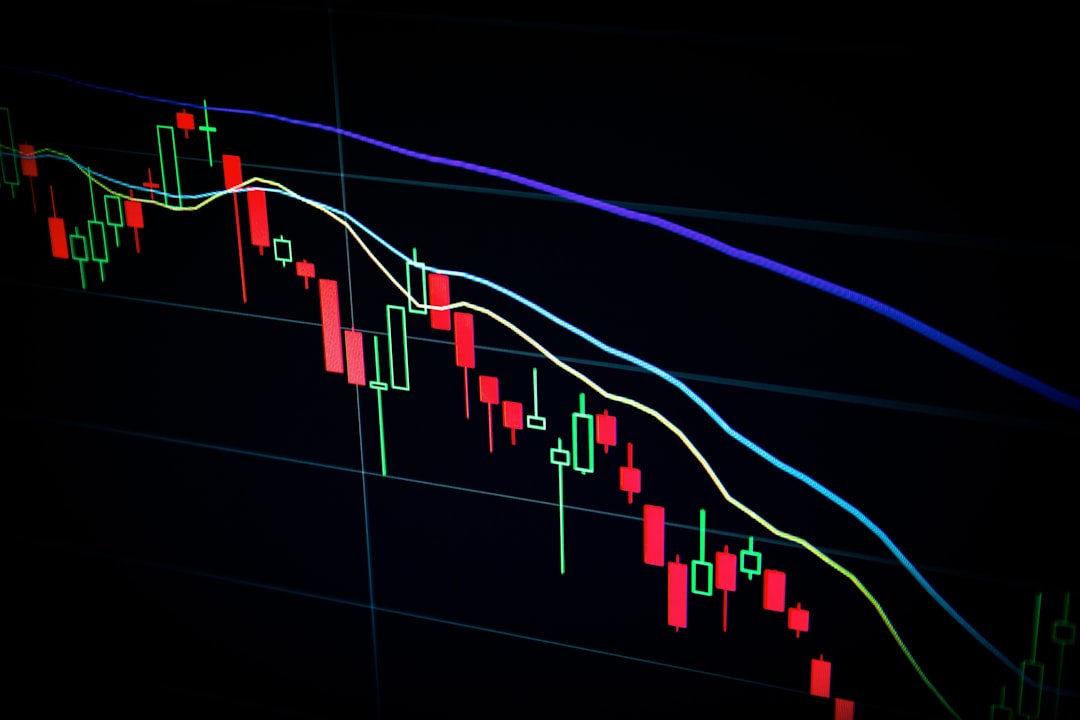
2. Watch for the Cross: Wait for the 50-day SMA to cross above the 200-day SMA. This is your trigger.
3. Confirm with Volume: Ideally, look for increasing trading volume on the day of the cross. Higher volume adds credibility to the signal.
4. Enter the Trade: Once the cross occurs, you can enter a long position. Some traders prefer to wait for a small pullback to get a better entry, but that’s optional.
5. Set Your Stop-Loss: Place a stop-loss just below the 200-day MA or a recent swing low to limit potential losses if the trade goes against you.
Remember, the Golden Cross works best in trending markets. In sideways or choppy conditions, it can produce false signals, so always consider the broader market context.
Risk Management
No strategy is foolproof, and the Golden Cross is no exception. Here’s how to protect your capital:
- Position Sizing: Never risk more than 1-2% of your trading account on a single trade. This ensures that even a few losses won’t wipe you out.
- Stop-Loss Orders: Always use a stop-loss. A common level is just below the 200-day MA or a recent support level. This caps your downside if the market reverses.
- Take Profit: Set a realistic profit target. You might aim for a 1.5x or 2x your risk (e.g., if you risk $100, target $150-$200). You can also trail your stop to lock in gains as the trend progresses.
- Avoid Overtrading: The Golden Cross is a medium-to-long-term signal. Don’t jump in and out on smaller timeframes—patience is key.
- Watch for False Crosses: Sometimes the cross happens, but the trend fails. If price falls back below the 200-day MA, exit immediately. Don’t hope—just exit.
Conclusion
The Golden Cross is a classic tool that can help you identify potential bull markets and ride trends with confidence. It’s not a magic bullet, but when combined with solid risk management and a clear trading plan, it becomes a valuable part of your arsenal. Remember, the goal is not to be right every time, but to make money over the long run by cutting losses and letting winners run. So, set up your charts, spot that cross, and trade smart. Happy trading!