
The Golden Cross: A Beginner’s Guide to This Powerful Moving Average Signal

Imagine watching a chart and seeing two lines cross. It might not seem like much, but for many traders, that simple crossover is a signal to pay attention. This is the Golden Cross, one of the most popular and enduring technical analysis patterns. It’s not a crystal ball, but it’s a powerful tool that can help you spot potential trend reversals and align your trades with the market’s momentum. In this guide, we’ll break down exactly what the Golden Cross is, how to spot it, and – most importantly – how to use it responsibly.
How It Works
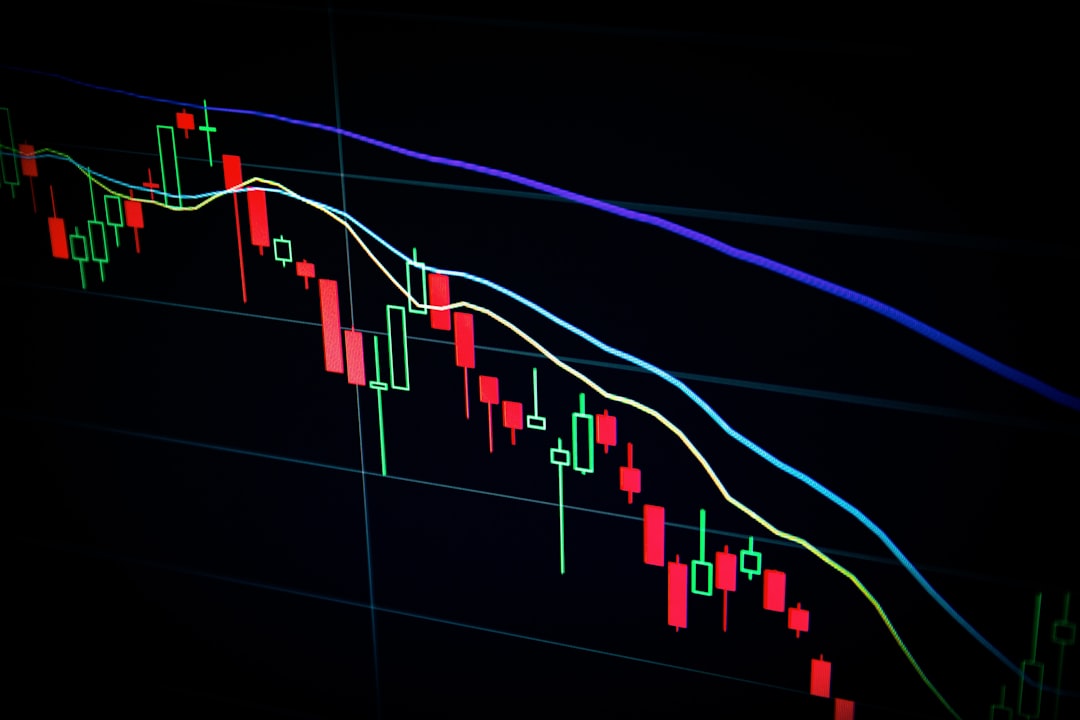
The Golden Cross is a bullish signal that occurs when a short-term moving average crosses above a long-term moving average. The most common pairing is the 50-day and 200-day moving averages. When the 50-day (the faster line) rises above the 200-day (the slower line), it suggests that recent price action is outpacing the longer-term trend. This shift often indicates that buyers are gaining control and a new uptrend may be starting.
Why does this matter? Moving averages smooth out price data to help you see the underlying trend. The 200-day is a widely watched level that many institutions use to gauge long-term health. When the shorter average crosses above it, it’s a sign that the market’s short-term pulse is stronger than its long-term heartbeat.
The Setup
To use the Golden Cross, you need a chart with the 50-day and 200-day simple moving averages (SMA) applied. Here’s how to set it up on most platforms:
1. Open your chart (TradingView, MetaTrader, etc.) and select the asset you want to analyze (e.g., Bitcoin, Ethereum, or a stock).
2. Add two moving averages: one with a period of 50 and another with a period of 200. Use ‘Simple’ as the type.
3. Look for the cross. The Golden Cross happens when the 50 SMA crosses from below to above the 200 SMA.
But don’t just buy on the cross alone. The best setups include confirmation:
- Volume: Look for increasing volume on the days around the cross. This shows that the move is backed by real buying interest.
- Price Action: The price should ideally be trading above both moving averages after the cross.
- Market Context: Is the asset in a downtrend that’s been going for a while? A Golden Cross after a long decline is more meaningful than one during a choppy range.
Risk Management
No signal is perfect, and the Golden Cross is no exception. It can produce false signals, especially in sideways markets. That’s why risk management is crucial:
- Position Sizing: Never risk more than 1-2% of your trading capital on a single trade. This protects you from a series of losses.
- Stop-Loss: Place a stop-loss below the recent swing low or below the 200-day moving average. If the price falls back below that level, the signal has failed, and you should exit.
- Take Profit: Set a realistic target. You can use a risk-reward ratio of 1:2 or 1:3. For example, if your stop is 5% away, aim for a 10-15% gain.
- Be Patient: Wait for the cross to happen, but also wait for a pullback to enter at a better price. This reduces your risk and improves your entry.
Remember, the Golden Cross is a lagging indicator – it tells you what has already happened, not what will happen next. So, always use it in conjunction with other tools like trendlines, support/resistance, or relative strength index (RSI).
Conclusion
The Golden Cross is a classic signal that has stood the test of time. It’s simple to understand, easy to spot, and can be a valuable addition to your trading toolkit. But remember, it’s not a magic bullet. The key to successful trading is combining signals with solid risk management and a disciplined approach. So, the next time you see those two lines cross, don’t just jump in – take a moment to assess the bigger picture. With practice, you’ll learn to use the Golden Cross as a powerful ally in your trading journey.