
Why Strategy’s Preferred Stock (STRC) Dropped to $83: A Complete Guide
Did you know that a preferred stock designed to stay at $100 can drop 17% in just five weeks? That’s exactly what happened to Strategy’s STRC, a high-yield preferred stock that fell to $83 on June 18, 2026—its lowest level since its launch in July 2025. This wasn’t a random market event. A combination of falling bitcoin prices, strategic capital decisions, and shifting investor confidence created a perfect storm. For crypto investors, understanding this timeline reveals how interconnected bitcoin’s price and corporate crypto strategies really are. This guide breaks down the sequence of events, explains each factor in plain language, and shows you what to watch for if you’re considering investments tied to bitcoin treasury companies.
Read time: 8-10 minutes
Understanding Preferred Stock for Beginners
Preferred stock is a type of company ownership that sits between common stock and bonds. Think of it like a hybrid—it pays a fixed dividend (like a bond’s interest payment) but represents ownership (like common stock). Unlike common shareholders, preferred stockholders receive their dividend payments first and have priority if the company goes bankrupt. However, they usually don’t get voting rights.
Why was STRC created? Strategy (formerly MicroStrategy) needed a way to raise capital to buy more bitcoin without diluting its common stock shareholders too much. By issuing STRC, they could attract income-focused investors who wanted predictable payments. The stock was designed to trade at its “par value” of $100—meaning investors could buy and sell it near that price. When it stays at $100, Strategy can sell new shares at fair value, raising money efficiently for more bitcoin purchases.
A real-world example: If you owned STRC, you’d receive an annual dividend of $11.50 per share (an 11.5% yield). As long as the stock traded near $100, you could sell it for roughly what you paid. But when it drops to $83, you’d lose money on the principal—even if you’re collecting dividends.
The Technical Details: How STRC’s Price Mechanism Works
STRC’s price stability depends on three key components working together:
1. Bitcoin as the underlying asset: Strategy’s entire value depends on its massive bitcoin holdings (846,842 BTC as of June 2026). When bitcoin’s price falls, investors question whether the company can maintain its dividend payments.
2. Cash reserve for dividends: Strategy built a dollar reserve fund to ensure it could pay dividends even during bitcoin downturns. This reserve acts as a safety buffer—but using it for other purposes reduces that protection.
3. Investor confidence and market perception: STRC buyers are income seekers who want low volatility. Any news that suggests dividend payments might be at risk—like a shrinking cash reserve—causes them to sell.
Why this structure matters for you: The same factors that affect STRC also influence other crypto-related financial products. When bitcoin drops, every security built around it feels the pressure. Understanding this chain reaction helps you evaluate similar investments.
Current Market Context: Why This Happened Now
The timeline of STRC’s decline reveals a cascade of events over just five weeks:
| Date | Key Event | Impact |
|---|---|---|
| May 14 | STRC at $100; bitcoin above $80,000 | Surface level normal, but underlying pressure building |
| May 15 | Strategy buys back $1.5B in bonds at 8% discount | Used cash reserve without disclosing it |
| May 26 | Confirmed cash reserve reduced to $871M (6 months of dividends) | Previously promised 24 months of coverage |
| June 1 | Strategy sells 32 BTC (first sale since 2022) | Signaling willingness to sell bitcoin if needed |
| June 5 | Bitcoin falls below $60,000 | STRC drops to $90 |
| June 18 | STRC hits $83 intraday | Lowest level ever |
As of mid-June 2026, Strategy held 846,842 BTC acquired at an average cost of $75,656. With bitcoin trading around $62,500, the company faced an unrealized loss of approximately $11.14 billion. Its common stock (MSTR) had fallen roughly 80% from its November 2024 all-time high, trading near $112.
Source: CoinDesk, data as of June 2026
Competitive Landscape: How STRC Compares to Similar Products
STRC isn’t the only crypto-linked preferred stock. Here’s how it stacks up against the main alternative:
| Feature | STRC (Strategy) | SATA (Strive Asset Management) |
|---|---|---|
| Dividend Yield | 11.5% annually | 13% annually |
| Dividend Frequency | Monthly (recently approved semi-monthly) | Daily |
| Backed by | Strategy’s bitcoin holdings and cash reserve | Strive’s bitcoin holdings |
| Par Value | $100 (designated) | Not specified |
| Recent Price | $88.59 (June 18 close) | Also dropped, CEO blamed leverage liquidation |
Why this matters: The competition created additional pressure on STRC. When Strive announced daily dividends on SATA, STRC investors demanded more frequent payments too. Strategy responded by seeking approval for semi-monthly dividends, but the change came amid falling bitcoin prices, making the adjustment less effective.
Practical Applications: Real-World Use Cases
Why should you care about preferred stock tied to bitcoin treasury companies?
- Income-focused crypto exposure: If you want bitcoin exposure plus regular income, STRC-style products offer a way to earn yields without directly holding volatile crypto.
- Understanding capital structure risk: Watching STRC’s decline teaches an important lesson—crypto companies’ financial health depends on both the crypto market and their management decisions.
- Evaluating dividend sustainability: A cash reserve covering only 6 months of dividends (versus the promised 24 months) signals higher risk. This metric applies to any dividend-paying crypto product.
- Recognizing signaling effects: When Strategy sold just 32 BTC (0.0038% of holdings), the market reacted negatively. Small actions can have outsized impacts during uncertain times.
Risk Analysis: Expert Perspective
Primary Risks:
1. Bitcoin price dependence: STRC’s entire value proposition relies on bitcoin staying above a certain threshold. A prolonged bear market could force Strategy to sell more bitcoin or cut dividends, causing further price declines.
2. Management decisions: Using the cash reserve for bond buybacks instead of dividend protection weakened investor confidence. This “capital structure” risk is often overlooked.
3. Market sentiment cascades: As seen on June 18, Strive CEO Matt Coles blamed a “leverage-driven liquidation” for the drop—suggesting forced selling amplified the decline beyond fundamental factors.
Mitigation Strategies:
- Diversify holdings across different asset types, not just crypto-linked securities
- Monitor cash reserve levels and debt obligations of any company you invest in
- Understand that even “low volatility” preferred stocks can experience sharp drops during market stress
Expert Consensus: The current situation reflects a combination of genuine fundamental pressure (falling bitcoin, reduced reserves) and market psychology (investor fear, leverage liquidations). No single event caused the decline—it was the accumulation of multiple factors over five weeks.
Beginner’s Corner: Quick Start Guide to Evaluating Crypto Preferred Stocks
If you’re considering investing in products like STRC, follow these steps:
1. Understand the underlying asset: What does the company own? In Strategy’s case, it’s bitcoin. Track bitcoin’s price and market trends.
2. Check the dividend coverage: How many months of dividend payments can the company make from its cash reserves? More months = lower risk.
3. Review the company’s debt: Does the company have large bond payments coming due? If so, it may need to use cash reserves for debt service instead of dividends.
4. Monitor management decisions: Watch for unexpected actions (like selling bitcoin or using reserves for other purposes) that could signal stress.
5. Compare alternatives: Check similar products like SATA. Higher yields may come with higher risks.
Common mistakes to avoid:
- Assuming a fixed par value means the price won’t move
- Ignoring the health of the company behind the security
- Confusing dividend yield with total return (you can lose principal)
Future Outlook: What’s Next
The key question for STRC investors is whether the stock can recover to $100. Several factors will determine this:
1. Bitcoin price recovery: If bitcoin rises back above $80,000, the pressure on Strategy’s balance sheet eases significantly. This is the most important variable.
2. Cash reserve rebuilding: Strategy’s recent statements suggest the reserve grew to $1.1 billion by mid-June. Continued rebuilding would restore investor confidence.
3. Competitive dynamics: How Strive’s SATA performs will influence STRC’s trading. If SATA stabilizes first, it could attract income-seeking investors away from STRC.
4. Market structure changes: The move to semi-monthly dividend payments may reduce volatility around ex-dividend dates, helping STRC trade closer to par for longer periods.
Speculation boundary: Some analysts predict recovery if bitcoin stabilizes, but specific price targets are uncertain. The situation remains fluid, and further bitcoin declines could push STRC lower.
Key Takeaways
- STRC’s drop from $100 to $83 resulted from a perfect storm of falling bitcoin prices, reduced cash reserves, management decisions, and competitive pressure.
- The cash reserve reduction from 24 months to 6 months of dividend coverage was a critical turning point that eroded investor trust.
- Strategy’s first bitcoin sale since 2022, while tiny (32 BTC), signaled management’s willingness to sell during stress, which rattled common stock holders.
- Understanding preferred stock mechanics helps investors evaluate similar crypto-linked products and avoid assuming stable prices mean stable investments.
,
“datePublished”: “2026-06-21T00:05:23.707-04:00”,
“dateModified”: “2026-06-21T00:05:23.707-04:00”,
“mainEntity”: {
“@type”: “Thing”,
“name”: “STRC preferred stock drop”
}
}
How to Bridge Assets Across Blockchains Safely: The Ultimate 2025 Guide
Bridging assets across blockchains is one of the most powerful tools in decentralized finance (DeFi). It allows you to move tokens like ETH, USDC, or SOL from one network to another—for example, from Ethereum to Arbitrum, or from Solana to BNB Chain. However, bridges are also prime targets for hacks and user errors. This guide will walk you through everything you need to know to bridge assets safely, avoid common pitfalls, and keep your funds secure.
Key Concepts
What is a Blockchain Bridge?
A blockchain bridge is a protocol that connects two independent blockchains, enabling the transfer of tokens and data between them. Bridges typically lock tokens on the source chain and mint equivalent tokens on the destination chain.
Types of Bridges
- Trusted Bridges: Rely on a central authority or federation to validate transactions. Examples: Binance Bridge, WBTC. Faster but require trust.
- Trustless Bridges: Use smart contracts and cryptographic proofs. Examples: Hop Protocol, Synapse, Stargate. More secure but may be slower.
- Liquidity Networks: Use liquidity pools to swap tokens across chains. Example: Across Protocol.
Common Risks
- Smart contract exploits: Bugs in bridge code can lead to loss of funds.
- Phishing attacks: Fake bridge websites that steal your private keys.
- Reorg attacks: Chain reorganizations can cause minting without locking.
- User error: Sending to the wrong address or chain.
Pro Tips
- Always double-check the bridge URL. Bookmark official bridge sites. Scammers create near-identical domains.
- Start with a small test transaction. Send a tiny amount first to confirm the bridge works correctly.
- Use a hardware wallet. Never enter your seed phrase into any website or bridge interface.
- Check bridge liquidity. Ensure the destination chain has enough liquidity to mint your tokens.
- Monitor gas fees. High fees can eat into your transfer. Bridge during low network activity.
- Verify the destination address. Always copy-paste addresses—never type them manually.
- Use bridges with proven security audits. Look for audits from firms like Trail of Bits, OpenZeppelin, or Certik.
For more details on this, check out our guide on Cold Storage vs Hot Wallets: Which Should You Choose? A Complete Guide for 2025.
FAQ Section
What is the safest blockchain bridge?
There is no single safest bridge—security depends on the protocol’s code, audits, and decentralization. Trustless bridges like Hop Protocol and Across Protocol are generally considered safer than centralized alternatives because they don’t rely on a single entity.
How long does a bridge transfer take?
It varies. Some bridges complete in seconds (e.g., Wormhole for Solana), while others may take several minutes (e.g., Arbitrum to Ethereum). Always check the estimated time on the bridge interface.
Can I lose my funds if a bridge gets hacked?
Yes. If a bridge’s smart contract is exploited, your locked tokens could be stolen. This is why it’s critical to use well-audited, battle-tested bridges and never bridge large amounts without testing first.
Do I need native gas tokens on both chains?
Yes. You need the native token of the source chain to pay for the transaction fee (e.g., ETH on Ethereum, SOL on Solana). On the destination chain, you’ll also need its native token to pay for future transactions.
What is the difference between a bridge and a cross-chain swap?
A bridge transfers the same asset from one chain to another (e.g., USDC from Ethereum to Polygon). A cross-chain swap exchanges one asset on one chain for a different asset on another chain (e.g., ETH on Ethereum for BNB on BNB Chain).
You might also be interested in reading about What Is Impermanent Loss? Liquidity Providing Explained.
Conclusion
Bridging assets across blockchains is an essential skill for any DeFi user, but it comes with real risks. By understanding how bridges work, following best practices, and using reputable tools, you can move your assets safely and efficiently. Always prioritize security over speed, test with small amounts, and keep your private keys offline. As the ecosystem evolves, bridges will only become more critical—so mastering them now will pay off in the long run.
RWA vs Pure DeFi Yields: Which Is Safer?
Real World Assets (RWAs) are tangible or intangible assets—such as real estate, bonds, commodities, and credit—that are tokenized on a blockchain. This process bridges the gap between Traditional Finance (TradFi) and Decentralized Finance (DeFi) by enabling fractional ownership, 24/7 liquidity, and transparent on-chain record-keeping. The core difference between RWA yields and pure DeFi yields lies in the source of returns: RWAs derive value from off-chain, regulated assets, while pure DeFi yields often come from on-chain liquidity mining, staking, or algorithmic trading strategies.
How RWA Tokenization Works
The technical process of bringing real-world assets on-chain involves several key steps:
- Asset Selection & Valuation: An asset (e.g., a commercial property or a government bond) is identified and appraised by a third-party auditor.
- Special Purpose Vehicle (SPV): A legal entity (SPV) is created to hold the asset, separating it from the issuer’s balance sheet and providing legal protection.
- Tokenization: The SPV issues digital tokens on a blockchain (e.g., Ethereum, Polygon) that represent fractional ownership or a claim on the asset’s cash flows.
- Oracle Integration: Oracles feed real-world data (e.g., interest rates, property valuations) onto the blockchain to ensure token prices reflect the underlying asset’s value.
- Secondary Market: Tokens are listed on exchanges or DeFi platforms, allowing investors to trade 24/7 with lower barriers to entry.
Investment Analysis: RWA vs Pure DeFi Yields
Pros of RWA Yields
- Stability: Returns are often backed by contractual cash flows (e.g., rental income, bond coupons), reducing volatility compared to algorithmic DeFi yields.
- Regulatory Clarity: Many RWA projects comply with securities laws, offering a safer legal framework for institutional and retail investors.
- Diversification: Access to traditional asset classes like real estate and private credit, which have low correlation with crypto markets.
Cons and Risks of RWA Yields
- Regulatory Risk: Changing laws around tokenized securities can affect the asset’s legality or tax treatment.
- Smart Contract Risk: Bugs in the tokenization or oracle contracts could lead to loss of funds.
- Liquidity Risk: Some RWA tokens may have thin secondary markets, making it hard to exit positions quickly.
Pros of Pure DeFi Yields
- High Potential Returns: Yields can be extremely high (e.g., 20–100% APY) during bull markets or from new protocols.
- Full Transparency: All transactions and smart contract code are publicly verifiable on-chain.
- No Intermediaries: No need for banks or brokers; users interact directly with protocols.
Cons and Risks of Pure DeFi Yields
- Impermanent Loss: Liquidity providers in automated market makers can suffer losses when token prices diverge.
- Smart Contract Exploits: DeFi protocols are frequent targets for hacks, with billions lost in 2023 alone.
- Regulatory Uncertainty: Many DeFi protocols operate in a legal gray area, exposing investors to potential enforcement actions.
For a broader market view, check out our analysis on Identity on Chain: KYC and Compliance in DeFi.
Investors often compare this to Bridging the Gap: How to Trade Real World Assets (RWA) Tokenization.
Tool Recommendation: Where to Trade RWA Tokens
When trading tokenized real-world assets, low fees and reliable liquidity are essential. We recommend using MEXC, a platform that offers competitive trading fees and a wide selection of RWA tokens. Low fees are crucial for this strategy. We recommend MEXC. Start trading on MEXC today.
Frequently Asked Questions
Are RWA yields safer than pure DeFi yields?
Generally, yes. RWA yields are backed by tangible assets or regulated contracts, making them less susceptible to crypto market volatility and smart contract exploits. However, they carry their own risks like regulatory changes and liquidity constraints.
What are the main risks of investing in tokenized real-world assets?
Key risks include regulatory uncertainty (securities laws), smart contract bugs, oracle manipulation, and lower secondary market liquidity compared to pure DeFi tokens.
Can I earn passive income from RWA tokens?
Yes. Many RWA tokens distribute yields from underlying assets (e.g., rental income, bond interest) to token holders, often paid in stablecoins or the native token. Platforms like MEXC list these tokens for easy access.
Conclusion
Both RWA and pure DeFi yields offer unique opportunities, but safety depends on your risk tolerance. RWA yields provide stability and regulatory clarity, making them suitable for conservative investors seeking exposure to traditional assets via blockchain. Pure DeFi yields offer higher potential returns but come with greater volatility and technical risks. For most investors, a balanced portfolio that includes both asset classes—traded on platforms like MEXC—can optimize risk-adjusted returns. Data from RWA.xyz shows that tokenized assets have grown over 300% in 2024, signaling strong institutional interest. As BlackRock and other major players enter the space, RWA yields are becoming a cornerstone of modern portfolio theory.
DePIN Explained: Earning Passive Income with Infrastructure
Decentralized Physical Infrastructure Networks (DePIN) are reshaping how we think about real-world assets and passive income. By contributing physical resources—like bandwidth, storage, or computing power—to a decentralized network, you can earn crypto rewards without active trading. This guide breaks down everything you need to know about DePIN, from key concepts to actionable tips.
What is DePIN?
DePIN stands for Decentralized Physical Infrastructure Networks. These are blockchain-based protocols that incentivize individuals to deploy and maintain physical infrastructure—such as wireless hotspots, data storage drives, or energy grids—in exchange for tokens. Unlike traditional centralized infrastructure (e.g., AWS or telecom towers), DePIN networks are community-owned and permissionless.
Key Concepts
- Token Incentives: Participants earn native tokens for providing verifiable services (e.g., Helium hotspots earn HNT for coverage).
- Proof of Work (Physical): Many DePIN projects use location or connectivity proofs to validate contributions.
- Passive Income Potential: Once hardware is set up, rewards accrue automatically with minimal maintenance.
- Real-World Utility: DePIN bridges blockchain with tangible services like internet access, cloud storage, or energy sharing.
Pro Tips for Maximizing DePIN Earnings
- Choose projects with strong tokenomics: Look for low inflation rates and clear demand for the service.
- Optimize hardware placement: For wireless networks, altitude and density matter. Use community maps to find gaps.
- Diversify across networks: Don’t put all your capital into one DePIN project. Spread risk across storage, compute, and connectivity.
- Monitor gas fees: Frequent reward claims on Ethereum can eat profits. Use L2 solutions or low-fee chains.
For more details on this, check out our guide on Liquidity vs Regulation: Why Crypto’s Real Winner Isn’t Who You Think.
Frequently Asked Questions
Is DePIN passive income really passive?
Yes, after initial setup and occasional maintenance, rewards are generated automatically. However, you may need to update firmware or reposition hardware for optimal earnings.
What hardware do I need to start?
It depends on the project. For example, Helium requires a LoRaWAN hotspot, while Filecoin needs storage drives. Many projects offer plug-and-play devices.
How much can I earn with DePIN?
Earnings vary widely based on network demand, hardware cost, and token price. Some users report $50–$500/month per device, but always DYOR.
Are DePIN tokens safe from hacks?
Smart contract risk exists. Stick to audited projects with active developer communities and avoid unaudited forks.
Conclusion
DePIN offers a unique way to earn passive income while contributing to decentralized infrastructure. By understanding the key concepts, optimizing your setup, and keeping fees low, you can build a resilient income stream. Start small, diversify, and always prioritize security.
You might also be interested in reading about How to Bridge Assets Across Blockchains Safely: A Step-by-Step Guide for 2025.

How to Stop Revenge Trading and Protect Your Portfolio
We’ve all been there. You take a trade that seems perfect, but the market moves against you. Frustration builds. Your next thought isn’t about strategy—it’s about getting even. You click the buy button again, this time doubling down. The trade goes south again, and suddenly you’re down three times what you planned. Welcome to the dangerous world of revenge trading.
Revenge trading is the emotional cycle of trying to recover losses quickly by taking impulsive, oversized, or poorly planned trades. It’s one of the fastest ways to blow up an account, and it happens to traders at every level. The good news? You can break the cycle.
Why Revenge Trading Happens
Revenge trading isn’t about logic—it’s about emotion. After a loss, your brain releases stress hormones like cortisol. This triggers a fight-or-flight response. Instead of walking away, you “fight” the market, believing you can force a win. Common triggers include:
- A single large loss (e.g., losing 5% of your account in one trade)
- A string of small losses that add up
- Watching someone else profit while you lose
- Feeling that the market “owes” you
The Setup: Recognizing the Revenge Mindset
The first step to stopping revenge trading is recognizing when you’re in the mindset. Watch for these warning signs:
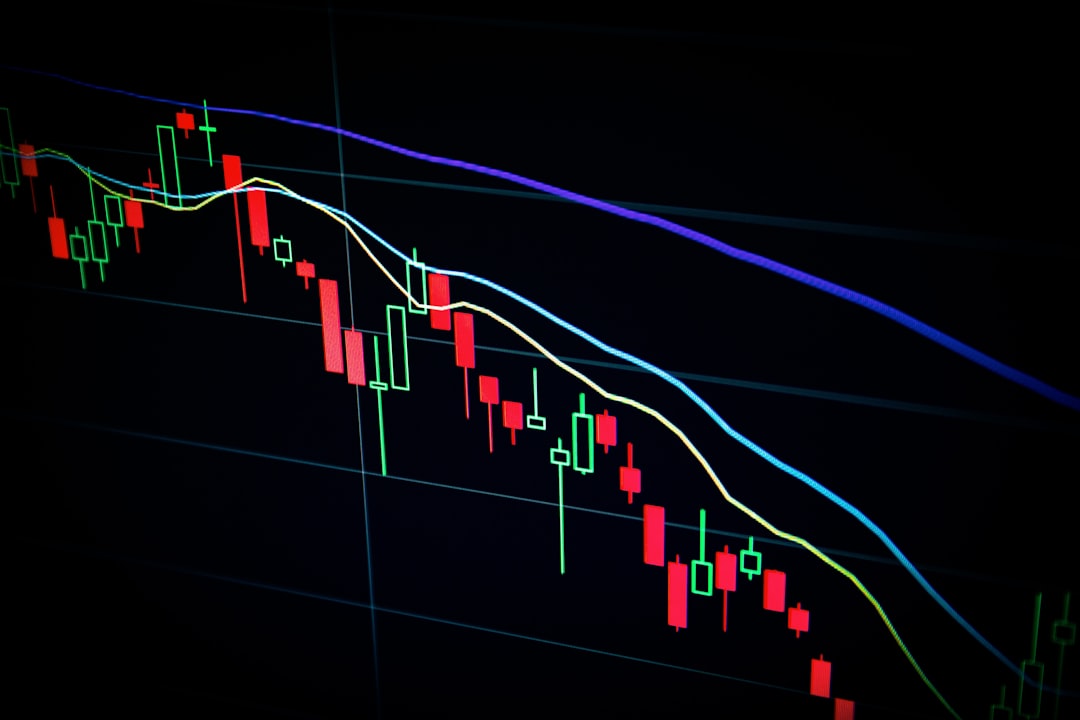
- Urgency: You feel you must trade right now to recover losses.
- Oversizing: You increase your position size beyond your normal risk limits.
- Ignoring your plan: You skip stop-losses, enter without confirmation, or trade outside your strategy.
- Physical tension: Your shoulders are tight, your heart is racing, or you’re clenching your jaw.
How It Works: Breaking the Cycle
If you feel the urge to revenge trade, follow this three-step process:
1. Pause and step away. Close your trading platform. Go for a 10-minute walk, drink water, or do breathing exercises. Physical movement lowers cortisol.
2. Journal the loss. Write down: What was the trade? What went wrong? How do you feel? This shifts your brain from emotional to analytical mode.
3. Re-enter with a plan. Only return to trading after you’ve waited at least 30 minutes (or the next day). Review your strategy rules. If the setup isn’t there, don’t trade.
Risk Management: The Ultimate Shield
The best defense against revenge trading is a solid risk management system that runs on autopilot. Implement these rules:
- Max loss per day: Decide a hard stop (e.g., 2% of your account). Once you hit it, you’re done for the day.
- Position sizing: Never risk more than 1% of your account on a single trade. This makes losses small and survivable.
- Consecutive loss limit: After three losses in a row, take a 24-hour break. Your judgment is impaired.
- Use a checklist: Before every trade, confirm it meets your strategy’s criteria. No checklist, no trade.
Conclusion
Revenge trading is a psychological trap, not a strategy flaw. Every trader faces it, but the ones who succeed are the ones who learn to pause, reflect, and reset. The market will always be there tomorrow. Your account won’t if you let emotions take control. Start today by setting your daily loss limit and committing to a 10-minute break after any loss. Your future self will thank you.
Remember: Controlled losses are part of the game. Revenge losses are optional.
How to Participate in Governance Proposals (DAOs): A Complete Guide for 2025
Decentralized Autonomous Organizations (DAOs) are reshaping how communities make decisions. Instead of a central authority, token holders vote on proposals that determine a project’s future—from treasury allocations to protocol upgrades. But participating effectively requires more than just holding tokens. This guide walks you through every step, from understanding proposal types to casting your vote securely.
Key Concepts
1. Governance Tokens
Most DAOs use a native token (e.g., UNI, COMP, MKR) that grants voting power. The more tokens you hold (or delegate), the more weight your vote carries. Some DAOs use quadratic voting or conviction voting to balance influence.
2. Proposal Lifecycle
- Temperature Check: Informal forum poll to gauge community sentiment.
- Formal Proposal: On-chain submission with a detailed description and execution code.
- Voting Period: Typically 3–7 days where token holders vote Yes, No, or Abstain.
- Execution: If quorum and majority thresholds are met, the proposal is executed automatically or by a multisig.
3. Delegation vs. Direct Voting
If you lack time to research every proposal, delegate your voting power to a trusted community member or a professional delegate (e.g., StableLab, GFX Labs). You retain ownership of your tokens while contributing to governance.
Pro Tips
- Always verify the proposal’s source. Scammers often create fake proposals that drain wallets. Only interact with official DAO interfaces (e.g., Tally, Snapshot, Boardroom).
- Understand the quorum. A proposal may pass with 90% yes votes but fail if minimum participation isn’t met. Check historical quorum rates.
- Use a dedicated governance wallet. Keep your main holdings separate to minimize risk if you interact with malicious contracts.
- Monitor voting power changes. Some tokens have vesting schedules or lockups that affect your voting weight over time.
FAQ Section
Q: Do I need to pay gas fees to vote?
It depends. On-chain votes (e.g., Compound, Uniswap) require gas fees. Off-chain votes via Snapshot are gasless but still require a signature. Always check the platform beforehand.
Q: Can I change my vote after submitting?
Most DAOs allow revoting before the voting period ends. However, each new vote incurs an additional gas fee on-chain. Off-chain platforms like Snapshot let you change your vote freely.
Q: What happens if a proposal passes but fails to execute?
Execution failures can occur due to insufficient gas, code bugs, or timelock conflicts. The DAO usually must submit a new proposal to fix the issue. Always review the execution code before voting.
Q: How do I find active proposals?
Use aggregators like Boardroom, Tally, or each DAO’s official governance forum. Many projects also announce proposals on Discord or Twitter.
Conclusion
Participating in DAO governance is one of the most empowering activities in crypto. It gives you a direct say in the projects you believe in. Start small—delegate your tokens to an experienced voter, follow a few proposals, and gradually build your confidence. For more details on this, check out our guide on Tax Loss Harvesting in Crypto: A Guide for Traders. You might also be interested in reading about How SPVs Protect RWA Investors: A Complete Guide.

The Hidden Power of Support and Resistance Flips: A Trader’s Guide
Have you ever watched a price level that once held like a rock suddenly turn into a springboard? That’s the magic of a support and resistance flip. It’s one of the most reliable concepts in technical analysis, yet many beginners overlook it. In this post, we’ll break down exactly what a flip is, how to spot it, and how to trade it with confidence.
How It Works
Support and resistance levels are not fixed lines; they’re zones where supply and demand battle. When price breaks through a support level, that same level often becomes new resistance. Why? Because traders who bought at support now want to break even, and sellers step in at that old floor. The same logic applies in reverse: a resistance level that gets broken can become new support.
The Setup
To trade a flip, follow these steps:
Looking for altcoin opportunities and smooth trading? Try KuCoin.
1. Identify a clear level – Look for a price zone where the asset has reversed at least twice (touches on a daily or 4-hour chart work best).

2. Wait for a strong break – Price must close decisively beyond the level (e.g., a candle close above resistance or below support).
3. Look for a retest – After the break, price often returns to the old level. This is your entry moment.
4. Enter on confirmation – Wait for a rejection candle or a bullish/bearish pattern at the retest. Then enter the trade in the direction of the break.
Example: Bitcoin breaks above $30,000 resistance. It later retests $30,000 as new support. You buy with a stop below $29,500 and target $32,000.
Risk Management
Flipping levels can fail – especially in choppy markets. Always use a stop loss just beyond the flip zone (e.g., 1–2% below the retested support for a long trade). Position size should be small (1–2% risk per trade). Also, avoid trading flips during major news events or low volume hours, as false breaks are common.
Conclusion
Support and resistance flips are a trader’s edge – simple, repeatable, and rooted in market psychology. Start by marking key levels on your charts, practice identifying flips on historical data, and soon you’ll see them everywhere. Remember: the trend is your friend, but the flip is your confirmation.
Tokenized Stocks: 24/7 Equity Trading Guide
Tokenized stocks represent a groundbreaking intersection of traditional equity markets and blockchain technology. By converting shares of publicly traded companies into digital tokens on a distributed ledger, investors can trade equities 24 hours a day, 7 days a week, bypassing the constraints of conventional market hours. This guide explores how tokenization works, its investment implications, and the tools you need to participate.
What Are Tokenized Stocks?
Tokenized stocks are blockchain-based representations of real-world equity shares. Each token is typically backed 1:1 by an underlying security held in a Special Purpose Vehicle (SPV) or custodial account. Unlike traditional stocks that trade only during exchange hours (e.g., 9:30 AM–4:00 PM EST on NYSE), tokenized versions can be exchanged on decentralized or centralized platforms at any time.
Off-chain vs On-chain: The off-chain asset is the actual stock certificate held by a regulated custodian. The on-chain token is a digital proxy that confers economic rights—dividends, price appreciation—to the holder. Oracles (e.g., Chainlink) feed real-time price data from traditional exchanges to the blockchain, ensuring the token price mirrors the underlying equity.
How Tokenization Works
The process involves several key steps:
- Asset Sourcing: A regulated entity (e.g., a broker-dealer) purchases the actual stock shares and places them in an SPV or trust.
- Token Minting: Smart contracts on a blockchain (commonly Ethereum, Polygon, or Solana) mint tokens representing fractional ownership of the SPV. Each token may represent 1/1000th of a share, enabling micro-investing.
- Oracle Integration: Decentralized oracles continuously stream the stock’s market price from exchanges like NYSE or Nasdaq to the blockchain, updating the token’s value in real time.
- Secondary Trading: Tokens are listed on compliant exchanges or DeFi protocols, allowing peer-to-peer trading 24/7. Settlement is near-instant, unlike T+2 in TradFi.
Investment Analysis
Pros
- 24/7 Liquidity: Trade equities at any hour, reacting to after-hours news or global events.
- Fractional Ownership: Buy a fraction of a high-priced stock (e.g., Amazon at $180) for as little as $1.
- Global Access: Investors in restricted markets can gain exposure to US equities via tokenized versions.
- Transparency: All transactions are recorded on a public ledger, reducing counterparty risk.
Cons & Risks
- Regulatory Uncertainty: Tokenized stocks may be classified as securities, subjecting them to SEC or local regulations. Compliance varies by jurisdiction.
- Smart Contract Risk: Bugs or exploits in the minting or trading contracts could lead to loss of funds.
- Custodial Risk: The off-chain custodian holding the actual shares could face insolvency or fraud.
- Oracle Manipulation: If price feeds are compromised, token prices may deviate from the underlying asset.
For a broader market view, check out our analysis on Kraken Custody Lawsuit Explained: What the Etana $25m Fraud Case Means for You. Investors often compare this to Identity on Chain: KYC and Compliance in DeFi.
Tool Recommendation
To trade tokenized stocks efficiently, you need a platform with deep liquidity and low fees. We recommend MEXC, which offers a wide range of tokenized equity pairs with competitive maker-taker fees. Low fees are crucial for this strategy, especially when executing frequent trades across different time zones. Start trading on MEXC today.
Frequently Asked Questions
Are tokenized stocks legal?
Yes, in many jurisdictions, provided the issuer complies with securities laws. Platforms like Swarm and Backed operate under regulated frameworks (e.g., Swiss FINMA or EU MiFID II). Always verify the regulatory status of the token issuer.
How do dividends work with tokenized stocks?
Dividends are typically distributed to token holders in stablecoins or the underlying fiat currency. The SPV collects the dividend from the custodian and distributes it pro-rata via smart contract. However, timing may differ from traditional dividend schedules.
What happens if the custodian goes bankrupt?
In a properly structured SPV, the underlying shares are ring-fenced from the custodian’s creditors. Token holders retain a claim on the assets. However, legal recovery may take time. Always review the SPV’s legal structure and insurance coverage.
Conclusion
Tokenized stocks offer a compelling bridge between TradFi and DeFi, enabling 24/7 equity trading with fractional ownership and global access. While regulatory and smart contract risks remain, the asset class is maturing with institutional backing from firms like BlackRock and Fidelity. For investors seeking round-the-clock exposure to equities, tokenization is a powerful tool—but due diligence on the issuer and platform is essential.
What is Impermanent Loss? Liquidity Providing Explained
Impermanent loss is one of the most misunderstood risks in decentralized finance (DeFi). If you provide liquidity to an automated market maker (AMM) like Uniswap, PancakeSwap, or SushiSwap, you’ve likely heard the term. In simple terms, impermanent loss occurs when the price of your deposited assets changes compared to when you deposited them. The larger the price change, the more you are exposed to impermanent loss. This guide breaks down what impermanent loss is, how it works, and how to minimize it.
Key Concepts
What is Impermanent Loss?
Impermanent loss (IL) is the temporary loss of funds that liquidity providers (LPs) can experience when providing liquidity to a liquidity pool. It happens when the price ratio of the two tokens in the pool changes. The loss is called “impermanent” because it only becomes permanent if you withdraw your liquidity at a time when the price ratio has shifted unfavorably. If the price returns to its original ratio, the loss disappears.
How Does Impermanent Loss Happen?
AMMs use a constant product formula (x * y = k) to maintain a balanced pool. When the price of one token rises relative to the other, arbitrageurs will trade against the pool to bring the price back in line with the broader market. This trading activity causes the pool to hold more of the depreciating asset and less of the appreciating asset. As a result, when you withdraw, you end up with a different proportion of tokens than you deposited, often worth less than if you had simply held the tokens.
Example of Impermanent Loss
Imagine you deposit $1,000 worth of Token A and $1,000 worth of Token B into a liquidity pool (total $2,000). If Token A doubles in price while Token B stays the same, arbitrageurs will buy Token A from the pool until the pool’s ratio reflects the new market price. When you withdraw, you might end up with roughly $1,333 in Token A and $667 in Token B (total $2,000). If you had simply held both tokens, you would have $1,500 in Token A and $1,000 in Token B (total $2,500). The $500 difference is your impermanent loss.
When Does Impermanent Loss Become Permanent?
Impermanent loss becomes permanent when you withdraw your liquidity at a time when the price ratio has not returned to its original state. If you wait for the price to return to the original ratio, the loss disappears. However, in volatile markets, prices rarely return to the exact starting point, so many LPs end up realizing the loss.
Pro Tips
- Choose stablecoin pairs: Pools with two stablecoins (e.g., USDC/USDT) have minimal impermanent loss because their prices are pegged.
- Use single-sided liquidity platforms: Some protocols like Bancor or Tokemak offer single-sided exposure, reducing IL risk.
- Stick to correlated assets: Pairs like ETH/stETH or WBTC/renBTC have lower price divergence and thus lower IL.
- Monitor trading fees: High-volume pools can generate enough fees to offset impermanent loss over time.
- Consider IL insurance: Some protocols offer insurance or protection against impermanent loss for a fee.
For more details on this, check out our guide on How to Participate in Governance Proposals (DAOs): A Complete Guide.
FAQ Section
Is impermanent loss guaranteed?
No. Impermanent loss only occurs if the price ratio of the deposited tokens changes. If the prices remain stable or return to the original ratio, there is no loss.
Can impermanent loss be negative?
No, impermanent loss is always a loss relative to holding. However, trading fees and yield farming rewards can sometimes offset or exceed the loss, resulting in a net profit.
How do I calculate impermanent loss?
You can use online calculators like the one on DailyDeFi or Zerion. Simply input the price change percentage to see the estimated loss.
Does impermanent loss apply to all liquidity pools?
It applies to any AMM-based liquidity pool that uses a constant product formula. Some newer models (e.g., concentrated liquidity, dynamic fees) can reduce IL but not eliminate it entirely.
What is the best strategy to avoid impermanent loss?
Providing liquidity to stablecoin pairs or using single-sided liquidity protocols are the most effective ways to avoid IL. Alternatively, you can focus on high-fee pools where fees outweigh potential losses.
You might also be interested in reading about Private Credit on Blockchain: Earning High Yields.
Conclusion
Impermanent loss is a key risk for any liquidity provider in DeFi. While it can be intimidating, understanding how it works and choosing the right pools can help you manage or even avoid it. Always weigh potential trading fees and incentives against the risk of IL before depositing. With the right strategy, providing liquidity can still be a profitable way to earn passive income in the crypto ecosystem.
Bitcoin Bounces 1.64% as Price Tests $64K Resistance Zone
June 20, 2026 — Bitcoin is trading at $63,629, up 1.64% in the past 24 hours, as the asset holds a recovery range carved out after a sharp selloff from roughly $81,600 down to a low near $59,100. Traders are now watching the $64,000 level as the deciding factor for the next directional move, with a confirmed breakout potentially opening the path toward $67,000.
Immediate Details & Direct Quotes
Want to trade this news? Bitget offers professional charting tools and deep liquidity.
The bounce off the $59,100 low on June 4 produced a string of higher lows on the daily chart, with price now consolidating between $63,000 and $64,000. Trading volume spiked during the capitulation phase and has since pulled back, a pattern that often signals fading panic selling rather than fresh distribution, according to the source report.
On the daily timeframe, resistance sits at $64,500 and again near $66,500, with major resistance layered at $67,000 to $68,000. Support holds at $62,000 to $63,000, with major support at $59,000 to $60,000. The recovery structure stays intact as long as Bitcoin holds above $62,000.
The 4-hour chart shows a clearer short-term uptrend, with price building a sequence of higher lows and higher highs after the drop to the $62,200 low. Recent candles show momentum slowing near $63,500 to $64,000, a pattern consistent with accumulation following the bounce.
Market Context & Reaction
Oscillator readings remain mostly neutral, providing no clear directional bias. The 14-day relative strength index (RSI) sits at 38, the Stochastic reads 48, and the commodity channel index (CCI) shows a negative 20. The moving average convergence divergence (MACD) level reads negative 2,248 but registers a bullish signal, while momentum at 2,195 also reads bullish. The Awesome oscillator, at negative 4,704, is the lone bearish signal.
Moving averages tell a different story. Every short and medium-term exponential moving average (EMA) and simple moving average (SMA), from the 10-period to the 200-period, sits above the current price and signals sell. The 200-day EMA sits at $77,964 and the 200-day SMA at $76,876, both far above the current $63,630 spot price. That overhead positioning produces a strong sell bias, even as oscillators stay flat.
Bitstamp’s live order flow backs up the range-bound read. Order book depth shows denser interest below the current price, with counts rising toward $54,000, compared with thinner counts on the way up toward $73,500.
Background & Historical Context
The current price action follows a severe selloff from roughly $81,600 down to a low near $59,100 on June 4. The asset has since recovered and carved out a defined trading band between $62,000 and $64,000. The pattern of fading volume during the selloff suggests the market absorbed the panic rather than extending it.
Traders are watching $64,000 as the level that decides the next move. A break and hold above that zone favors continuation toward $65,000, $66,000, and $67,000. A drop below $63,000 reopens the door to $62,200 and then $61,000. With Bitcoin’s 24-hour range running from $62,335 to $63,770, the asset remains in a defined band pending a decisive break in either direction.
What This Means
The bullish case rests on Bitcoin holding above $62,000, with the structure since the $59,100 low still favoring buyers. Higher lows on the 4-hour chart, fading volume during the selloff, and tight order flow all point to a market that absorbed the panic. A close above $64,000 opens a direct path to $65,000, $66,000, and $67,000.
The bearish case highlights every short and medium-term moving average sitting above current price, with overhead supply that doesn’t disappear because oscillators went flat. Bitcoin is trading roughly $14,000 below its 200-day EMA, a gap that keeps sellers in position on every bounce. Until price reclaims $64,000 and holds it, the path of least resistance runs through resistance, not support.
This is not financial advice. Always conduct your own research before making investment decisions.
—