Chart Patterns 101: Spotting Reversals with Head & Shoulders & Double Bottoms
Ever feel like the market is speaking a secret language? Price charts are its vocabulary, and specific patterns are its most telling phrases. For traders, learning to spot these patterns is like learning to read the market’s intentions. Today, we’re decoding two of the most powerful and reliable reversal patterns: the Head and Shoulders (a bearish signal) and the Double Bottom (a bullish signal). Mastering these can help you identify potential trend changes before the crowd catches on.
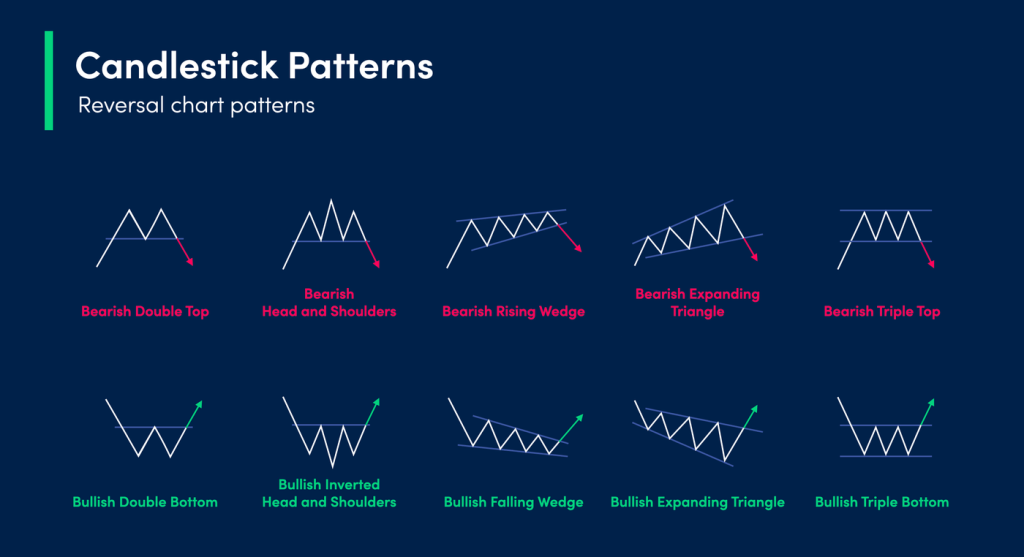
The Head and Shoulders Pattern: The Classic Trend Killer
This pattern signals that an uptrend is exhausted and a bearish reversal is likely. It gets its name from its distinct shape, which resembles a head with two shoulders.
How it Works
Think of it as a story of failed momentum. The price makes a high (left shoulder), pulls back, then makes an even higher high (the head). It pulls back again, and on its next attempt to rally, it can only reach about the same height as the first shoulder (right shoulder) before falling. This failure to make a new high shows that buying pressure is drying up.
The Setup
1. Identify the Uptrend: The pattern forms after a sustained move higher.
2. Spot the Three Peaks: Look for three consecutive peaks.
* Left Shoulder: A peak followed by a decline.
* Head: A higher peak followed by a decline.
* Right Shoulder: A lower peak (similar height to the left shoulder) followed by a decline.
3. The Neckline: This is the key. Draw a trendline connecting the low points (the troughs) between the shoulders and head. This is your support level.
Entry & Exit Rules
* Confirmation is KEY: The pattern is only valid once the price closes below the neckline after the right shoulder forms. This is your sell/short signal.
* Price Target: A common method is to measure the vertical distance from the top of the head down to the neckline. Then, project that same distance downward from the neckline breakout point. This gives you a minimum expected move.
* Stop Loss: A logical place is just above the right shoulder.
The Double Bottom Pattern: The Trend Rejuvenator
This is the bullish counterpart to the Head and Shoulders. It signals that a downtrend is ending and a new uptrend is beginning. It looks like a “W” on the chart.
How it Works
This pattern shows a battle where sellers try twice to push the price lower but fail. The price finds strong support at a similar level twice, indicating that buyers are aggressively stepping in at that price, creating a solid floor.
The Setup
1. Identify the Downtrend: The pattern forms after a sustained move lower.
2. Spot the Two Troughs: Look for two distinct lows that are roughly equal in price.
3. The Resistance (Breakout) Level: Draw a horizontal line across the peak that forms between the two bottoms. This is your resistance level.
Entry & Exit Rules
* Confirmation is KEY (Again!): The pattern is confirmed when the price closes above the resistance line (the peak between the bottoms). This is your buy/long signal.
* Price Target: Measure the vertical distance from the resistance line down to the bottom of the troughs. Project that same distance upward from the breakout point.
* Stop Loss: A logical place is just below the lowest point of the second bottom.
A Quick Word on Risk Management
Never risk more than 1-2% of your trading capital on a single idea. These patterns are powerful tools, but they are not infallible. A stop-loss order is non-negotiable. It’s your seatbelt for the trading journey.
Tools for the Trade
To practice spotting these patterns, you need a platform with clean, customizable charts. Platforms like [Bitget](https://partner.bitget.site/bg/SVJSDD) offer great charting tools for this setup, allowing you to draw trendlines, measure distances, and backtest your observations on different timeframes.
Conclusion: Your New Trading Lens
The Head and Shoulders and Double Bottom patterns are foundational skills for any technical trader. They provide a structured framework for understanding market psychology—shifts from greed to fear and from fear to greed. Start by looking for these shapes on historical charts. Then, move to a demo account to practice identifying the confirmation breakout without risking real capital. Remember, patience for the confirmed signal separates the prepared trader from the impulsive one. Happy charting!