
How to Participate in Governance Proposals (DAOs): A Complete Guide
Decentralized Autonomous Organizations (DAOs) are reshaping how communities make decisions. By holding governance tokens, you can vote on proposals that determine a project’s future—from treasury management to protocol upgrades. This guide walks you through everything you need to know to participate effectively in DAO governance.
Key Concepts
- Governance Tokens: Tokens that grant voting power in a DAO (e.g., UNI, COMP, MKR). The more tokens you hold or delegate, the more influence you have.
- Proposals: Formal suggestions for changes or actions, often requiring a minimum token threshold to submit. Proposals go through stages like discussion, voting, and execution.
- Voting Mechanisms: Common methods include token-weighted voting (one token = one vote), quadratic voting (to reduce whale dominance), and conviction voting (where votes gain power over time).
- Delegation: Assigning your voting power to a trusted representative if you lack time or expertise to vote on every proposal.
- On-chain vs. Off-chain Voting: On-chain votes are recorded directly on the blockchain (e.g., via Snapshot or Aragon), while off-chain votes use platforms like Discourse or Discord for signaling before an on-chain execution.
Pro Tips
- Research before you vote: Read proposal discussions on forums like Discourse or Commonwealth to understand trade-offs and community sentiment.
- Start small: If you’re new, delegate your tokens to a reputable delegate first to learn the process without risking poor voting decisions.
- Stay active: Join the DAO’s Discord or Telegram to get real-time updates and ask questions about upcoming proposals.
- Watch for gas fees: On-chain voting can be expensive on Ethereum. Use layer-2 solutions or vote during low-gas periods to save costs.
FAQ Section
What do I need to participate in DAO governance?
You need a wallet (e.g., MetaMask) and the DAO’s governance token. Some DAOs also require you to hold tokens on a specific network or stake them.
Can I vote without holding tokens?
Yes, many DAOs allow token delegation. You can delegate your voting power to a community member or expert without giving up custody of your tokens.
How do I find active proposals?
Check platforms like Snapshot, Tally, or the DAO’s official forum. Most DAOs also announce proposals on their social channels.
What happens after a proposal passes?
If the vote is on-chain, the proposal is executed automatically via smart contract. Off-chain proposals require the DAO’s core team or multisig to implement the changes.
For more details on this, check out our guide on Sony Bank Wins Conditional OCC Approval For US Dollar Stablecoin Trust Bank.
You might also be interested in reading about Zcash Orchard Exploit Explained: What the ZEC Counterfeiting Bug Means for Privacy Coins.
Conclusion
Participating in DAO governance is a powerful way to shape the projects you believe in. By understanding key concepts like token voting, delegation, and proposal stages, you can become an active and informed community member. Start small, stay engaged, and always do your own research before casting a vote. The future of decentralized decision-making is in your hands.
Robinhood Chain Nears Base With 7.6M Daily Transactions Just 11 Days After Launch
July 11, 2026 — Robinhood Chain has processed 7.6 million daily transactions just 11 days after its mainnet launch, narrowing the gap with Coinbase’s Base and accelerating competition among Ethereum Layer 2 networks. The Arbitrum-powered network recorded the figure on July 11 while Base processed 9.2 million transactions over the same period, according to on-chain data from MSBIntel verified by Token Terminal.
Immediate Details & Direct Quotes
Want to trade this news? Bitget offers professional charting tools and deep liquidity.
The rapid activity surge comes as Robinhood covers gas fees for users through a 90-day subsidy ending in September 2026. Data cited by MSBIntel and Token Terminal showed Robinhood Chain generated roughly $4,000 in daily protocol fees despite the temporary cost waiver. “Robinhood Chain processed 7.6 million transactions yesterday, nearing Base’s 9.2 million, eleven days after mainnet,” MSBIntel reported via social media. “Base users pay for every transaction; Robinhood covers gas on its chain through a 90-day subsidy.”
The network launched alongside Robinhood’s tokenized equities platform, giving it access to approximately 23 million brokerage users. Tokenized stocks are available in more than 120 countries, providing an additional source of potential activity. The network also surpassed $500 million in single-day volume on Uniswap deployments, taking the second position behind Ethereum mainnet, according to the report.
Market Context & Reaction
The activity difference between Robinhood Chain and Base has narrowed considerably since Robinhood’s July 1 launch. Robinhood overtook Base as the second-largest Uniswap deployment by spot activity, indicating liquidity growth alongside transaction volume. Unlike Base, which launched with Coinbase’s exchange ecosystem and early integrations with decentralized applications such as Uniswap and Chainlink, Robinhood entered the market with its brokerage user base.
Robinhood’s blockchain expansion has influenced sentiment around its publicly traded shares. The company’s initial Layer 2 announcement lifted HOOD stock by about 10%, while its later rollout of AI-powered agentic trading coincided with another gain of roughly 7%, according to Yahoo Finance data. Robinhood has connected its tokenized stock offering with infrastructure from several blockchain projects. Chainlink provides oracle pricing for 95 tokenized equities, including Nvidia, Apple, and Alphabet, while Uniswap supplies trading liquidity and Morpho supports lending functionality.
Background & Historical Context
Robinhood Chain is built using Arbitrum technology, the company confirmed earlier this week. The network launched alongside a tokenized equities platform, expanding Robinhood Markets beyond its brokerage business into blockchain infrastructure. The rapid increase in transactions has drawn attention from blockchain analysts and investors tracking Robinhood Markets’ stock.
The current gas subsidy expires at the end of September 2026, removing the cost advantage that has encouraged heavy network usage during launch. FalconX estimated in an April 2026 report that Robinhood Chain could generate about $1.1 million in fees over six months, although the temporary fee subsidy is expected to reduce revenue during its initial rollout.
What This Means
Investors are watching whether network activity remains strong after the promotional period ends. Once users begin paying transaction fees, on-chain activity will provide a clearer picture of whether tokenized assets and decentralized finance usage can sustain current volumes beyond launch-driven trading.
Attention is now turning to Robinhood’s early August earnings release for the second quarter of 2026. This will be the company’s first financial report to include data from the live mainnet. Investors are expected to watch for evidence that blockchain infrastructure is beginning to contribute to Robinhood’s long-term revenue strategy. The question remains whether free gas incentives and tokenized equities can maintain user engagement without subsidies.
—
Master the RSI Divergence Strategy: Spot Reversals Before They Happen
Imagine being able to spot a market top or bottom before it forms—while everyone else is still chasing the trend. That’s the power of RSI divergence. It’s one of the most reliable signals in technical analysis, and it can give you a serious edge in your trading.
In this guide, you’ll learn exactly how to use the RSI divergence strategy, step by step. We’ll cover what it is, how to spot it, and most importantly—how to trade it safely.
How It Works
The Relative Strength Index (RSI) is a momentum oscillator that measures the speed and change of price movements. Normally, RSI moves in the same direction as price. But when they start to disagree, that’s divergence.
Looking for altcoin opportunities and smooth trading? Try KuCoin.
There are two types:
- Bullish Divergence: Price makes a lower low, but RSI makes a higher low. This suggests selling momentum is weakening, and a reversal to the upside may be coming.
- Bearish Divergence: Price makes a higher high, but RSI makes a lower high. This suggests buying momentum is fading, and a drop may be ahead.
The Setup
Here’s a simple step-by-step to trade RSI divergence:
1. Identify the trend: Divergence works best in a clear trend. Don’t use it in choppy, sideways markets.
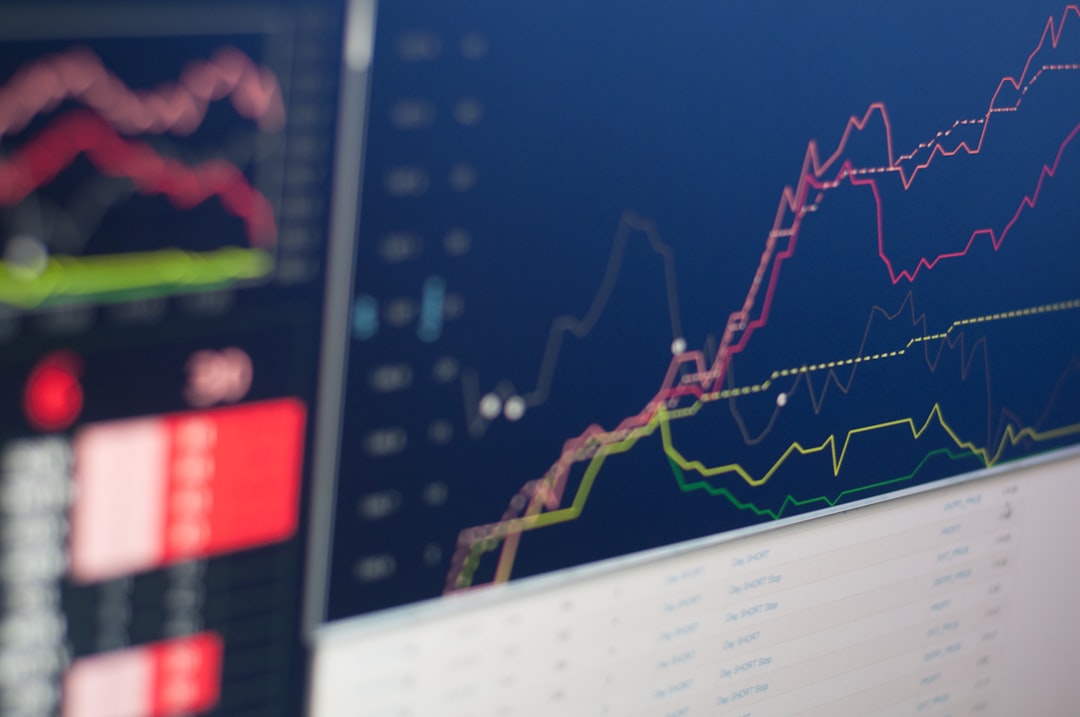
2. Look for the divergence: Wait for price to make a new swing high (for bearish) or new swing low (for bullish) while RSI does the opposite.
3. Wait for confirmation: Don’t jump in immediately. Wait for price to break a key level—like a trendline or a recent swing point—in the direction of the expected reversal.
4. Enter the trade: Once confirmed, enter with a stop loss above the recent swing high (for bearish) or below the recent swing low (for bullish).
Example: If you see a bullish divergence on the 1-hour chart of Bitcoin—price making lower lows, RSI making higher lows—and then price breaks above a short-term resistance, that’s your signal to go long.
Risk Management
No strategy is perfect. Divergence can fail, especially in strong trends. Here’s how to protect yourself:
- Always use a stop loss: Place it just beyond the most recent swing point. Never risk more than 1-2% of your account per trade.
- Check higher timeframes: A divergence on a 15-minute chart is less reliable than one on a daily chart. Use higher timeframes (4H, daily) for stronger signals.
- Combine with other tools: Use support/resistance, trendlines, or moving averages to confirm. Divergence alone isn’t enough.
- Be patient: Wait for the confirmation step. Many traders lose money by entering too early.
Conclusion
The RSI divergence strategy is a powerful tool for catching reversals early. It helps you think like a contrarian and avoid buying tops or selling bottoms. Practice spotting it on historical charts first, then start with small position sizes. Over time, you’ll develop an eye for these hidden opportunities.
Remember: The market rewards patience and discipline. Use divergence as a warning sign, not a guarantee. Combine it with solid risk management, and you’ll be well on your way to more consistent trades.
How to Bridge Assets Across Blockchains Safely: A Step-by-Step Guide
Introduction
As the blockchain ecosystem expands, moving assets between different networks—such as Ethereum, Solana, Polygon, and Binance Smart Chain—has become essential for traders, DeFi users, and NFT collectors. However, bridging assets carries risks, including smart contract vulnerabilities, front-running attacks, and permanent loss of funds. This guide will walk you through the safest methods to bridge your crypto assets across blockchains, covering key concepts, pro tips, and recommended tools.
Key Concepts
- Bridge: A protocol that locks tokens on one chain and mints equivalent tokens on another chain.
- Wrapped Tokens: Tokens representing an asset from another blockchain (e.g., Wrapped Bitcoin on Ethereum).
- Trustless vs. Custodial Bridges: Trustless bridges rely on smart contracts and validators, while custodial bridges use a central authority to manage funds.
- Liquidity Pools: Pools that facilitate cross-chain swaps by holding tokens on both sides of the bridge.
- Slashing & Security: Some bridges require validators to stake collateral, which can be slashed for malicious behavior.
Pro Tips
- Always verify the bridge’s security history. Check for past audits, bug bounties, and community reputation.
- Start with a small test transaction. Send a minimal amount first to confirm the bridge works correctly.
- Use bridges with decentralized validator networks to reduce single points of failure.
- Double-check the destination address. A typo can result in permanent loss.
- Monitor gas fees and slippage. High network congestion can make bridging expensive or cause failed transactions.
- Consider using a multi-bridge aggregator to compare routes and fees.
💡 Pro Tip
Looking for altcoin opportunities and smooth trading? Try KuCoin.
For more details on this, check out our guide on Restaking Explained: EigenLayer and Beyond – The Ultimate Guide to Crypto Restaking.
FAQ Section
1. What is the safest bridge to use?
There is no single safest bridge—security depends on the protocol’s design, audits, and track record. Popular options include Wormhole, LayerZero, and Synapse. Always do your own research.
2. Can I lose my funds when bridging?
Yes. Risks include smart contract bugs, validator collusion, and phishing attacks. Always use reputable bridges and double-check transaction details.
3. How long does a bridge transaction take?
It varies from a few seconds to several minutes, depending on network congestion and the bridge’s confirmation mechanism.
4. Do I need gas on both chains?
Yes. You need the native token (e.g., ETH, SOL) on both the source and destination chains to pay for transaction fees.
5. What is a wrapped token?
A wrapped token is a representation of an asset from another blockchain, backed 1:1 by the original asset held in a smart contract or custodian.
Conclusion
Bridging assets across blockchains opens up a world of opportunities in DeFi, NFTs, and trading. By understanding the key concepts, following security best practices, and using trusted tools, you can minimize risks and move your assets safely. Always stay informed about the latest bridge developments and never rush a transaction. Happy bridging!
You might also be interested in reading about Anthropic Launches Claude Fable 5 with Enhanced Safety Controls.
Carbon Credits: How Tokenization Is Fixing the Market
The global carbon credit market is valued at over $900 billion, yet it remains fragmented, illiquid, and plagued by double-counting and opacity. Tokenization—the process of representing real-world assets (RWAs) on a blockchain—offers a radical fix. By converting carbon credits into digital tokens, the market gains transparency, instant settlement, and global accessibility. This guide explains how tokenization works, its investment potential, and where to start.
What Are Carbon Credits? Off-Chain vs. On-Chain
A carbon credit represents one tonne of CO₂ avoided or removed from the atmosphere. Off-chain, these credits are issued by registries like Verra or Gold Standard, traded over-the-counter, and often sit in opaque databases. On-chain, each credit is minted as a unique token—typically an ERC-1155 or ERC-721—backed by a verified project. The key difference: on-chain credits are transparent, divisible, and tradeable 24/7 on decentralized exchanges.
How Tokenization Works
The process follows a structured framework:
- Project Verification: A carbon project (e.g., reforestation, methane capture) is validated by a registry.
- SPV Creation: A Special Purpose Vehicle (SPV) holds the legal rights to the credits, isolating them from the project developer’s balance sheet.
- Token Minting: The SPV issues tokens on a blockchain (e.g., Ethereum, Polygon) representing fractional ownership of the credits.
- Oracle Integration: Oracles like Chainlink feed real-time data (credit price, retirement status) onto the chain.
- Secondary Trading: Tokens trade on DeFi platforms or centralized exchanges, providing liquidity.
Investment Analysis: Pros, Cons, and Risks
Tokenized carbon credits offer unique advantages but carry distinct risks.
Pros
- Liquidity: Fractional tokens enable small investors to participate, unlike the wholesale off-chain market.
- Transparency: Every credit’s origin, serial number, and retirement is recorded immutably.
- Global Access: Anyone with a wallet can buy, sell, or retire credits, bypassing intermediaries.
Cons
- Regulatory Uncertainty: Jurisdictions differ on whether tokens are securities or commodities.
- Smart Contract Risk: Bugs in minting or redemption contracts can lead to loss of funds.
- Quality Variance: Not all projects are equal; some may overstate carbon removal.
For a broader market view, check out our analysis on Stablecoin Yield Strategies: Low Risk Farming – A Comprehensive Guide. Investors often compare this to Private Credit on Blockchain: Earning High Yields.
Tool Recommendation
To explore tokenized carbon credits safely, start on a regulated platform. Binance offers a dedicated carbon credit trading pair and educational resources. You can practice this setup safely on Binance. Sign up here.
FAQ
Are tokenized carbon credits regulated?
Regulation varies by jurisdiction. In the EU, tokenized credits may fall under MiCA; in the US, the SEC may classify them as securities if they represent an investment contract. Always consult a legal advisor.
How do I retire a tokenized carbon credit?
Most platforms allow you to send the token to a ‘retirement’ smart contract, which permanently removes it from circulation and issues a certificate. The on-chain record ensures it cannot be resold.
What is the minimum investment?
Because tokens are fractional, you can buy as little as $10 worth of a carbon credit. This democratizes access compared to the off-chain market, where minimums often exceed $100,000.
Conclusion
Tokenization is not a panacea, but it addresses the carbon market’s core inefficiencies: opacity, illiquidity, and high barriers to entry. For investors, it offers a transparent, liquid asset class with real environmental impact. However, due diligence on project quality and regulatory status is essential. As the RWA sector matures, tokenized carbon credits could become a cornerstone of both climate finance and diversified portfolios.
The Golden Cross: Your Blueprint for Riding Major Crypto Trends
Imagine you’re watching the charts, and suddenly the stars align—two moving averages cross in a way that historically signals a massive price surge. That’s the Golden Cross, one of the most beloved trend-following indicators in crypto trading. It’s not magic, but when understood and used correctly, it can help you catch big moves with confidence.
How It Works
The Golden Cross occurs when a short-term moving average (typically the 50-period moving average) crosses above a long-term moving average (commonly the 200-period moving average). This crossover signals that recent price momentum is shifting bullish, and the longer-term trend is turning up. In crypto, where trends can be explosive, this is often the starting pistol for a sustained rally.
The Setup
To trade the Golden Cross, you’ll need:
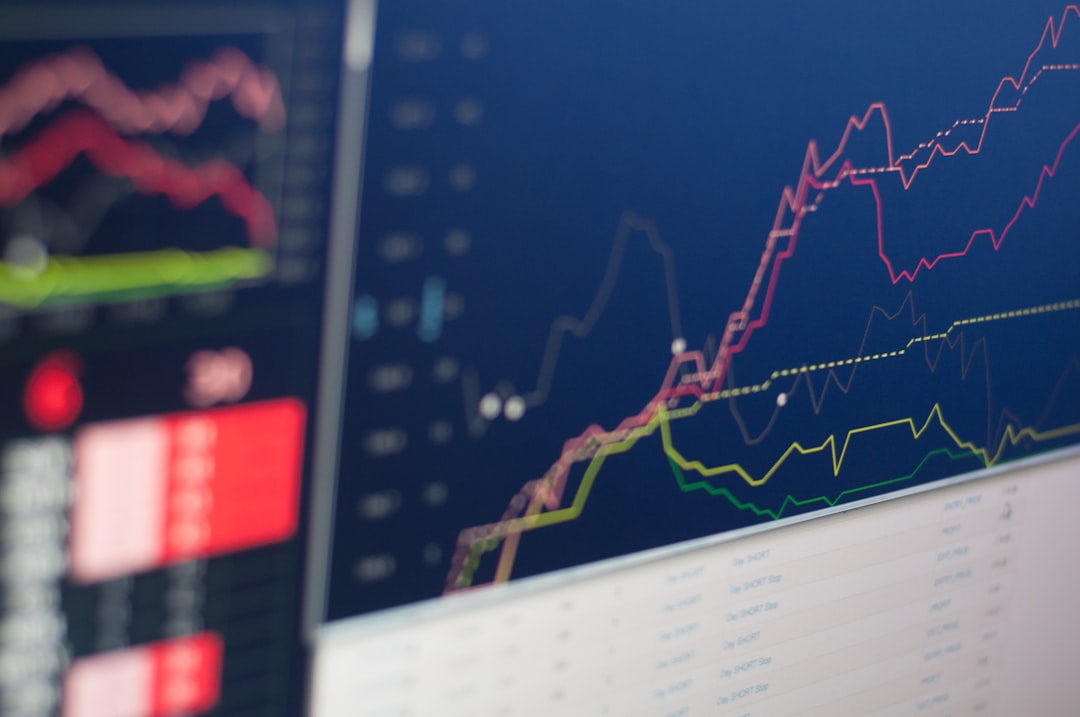
- A chart with the 50-period moving average (blue line) and the 200-period moving average (red line).
- A clear crossover event: the blue line rises above the red line.
- Confirmation: look for increased volume or a strong bullish candle on the crossover day to avoid false signals.
Example: Bitcoin’s daily chart in 2023 showed a Golden Cross in January, followed by a 50%+ rally over the next two months. The key? The crossover happened after a period of consolidation, not during a volatile spike.
Risk Management
No signal is perfect. Here’s how to protect your capital:
- Set a stop-loss below the recent swing low or at the 200-period moving average itself.
- Take partial profits at key resistance levels (e.g., previous highs or Fibonacci extensions).
- Avoid trading against the trend—if the Golden Cross forms on the daily chart, stick to buying dips, not shorting.
- Use a risk-reward ratio of at least 1:2. If your stop is 5% below entry, aim for a 10% profit target.
Conclusion
The Golden Cross is a powerful tool in your crypto trading toolkit, but it’s not a standalone system. Combine it with volume analysis, support/resistance levels, and proper risk management. When the blue line crosses above the red, you’ll know the tide is turning—and with discipline, you can ride the wave to new highs.
How to Read a Smart Contract Audit Report: A Comprehensive Guide for Crypto Investors
Smart contract audits are essential for ensuring the security and reliability of decentralized applications (dApps) and DeFi protocols. However, audit reports can be dense, technical, and intimidating for non-developers. This guide breaks down how to read a smart contract audit report, highlighting key sections, red flags, and actionable insights to help you make informed investment decisions.
Key Concepts
1. What Is a Smart Contract Audit?
A smart contract audit is a systematic review of a blockchain-based program’s code to identify vulnerabilities, logical errors, and inefficiencies. Audits are typically performed by specialized security firms like Trail of Bits, ConsenSys Diligence, or OpenZeppelin.
2. Common Sections in an Audit Report
- Executive Summary: A high-level overview of findings, including the number and severity of issues.
- Scope: Lists the contracts and files reviewed, along with the audit methodology.
- Findings: Detailed descriptions of vulnerabilities, categorized by severity (Critical, High, Medium, Low, Informational).
- Recommendations: Suggested fixes or improvements.
- Conclusion: Overall assessment of the contract’s security posture.
3. Severity Levels Explained
- Critical: Can lead to loss of funds or permanent contract failure. Must be fixed before deployment.
- High: Significant risk but may require specific conditions to exploit.
- Medium: Potential issues that could affect functionality or user experience.
- Low: Minor issues, often best practices violations.
- Informational: Suggestions for optimization or clarity.
Pro Tips
1. Don’t Just Look at the Number of Findings
A report with zero critical issues is great, but also check if the team has resolved all findings. Some projects publish an audit with unresolved high-severity bugs, which is a red flag.
2. Verify the Auditor’s Reputation
Not all audit firms are equal. Check if the auditor is well-known and has a track record of finding real vulnerabilities. Avoid audits from unknown or unverified firms.
3. Look for Re-Audits or Follow-Ups
If the team fixed issues after the initial audit, a re-audit or verification report should be published. This shows commitment to security.
4. Understand the Scope
An audit that only covers a small portion of the codebase may miss critical vulnerabilities in other parts. Ensure the scope matches the project’s complexity.
FAQ Section
Q: Can I trust a project that has no audit?
Generally, no. Reputable DeFi projects always undergo at least one audit. Lack of an audit is a major red flag.
Q: What if the audit report is outdated?
Smart contracts can be upgraded or modified after an audit. Always check if the audit covers the current version of the code.
Q: How do I find audit reports?
Most projects publish audit reports on their website, GitHub, or platforms like GitHub and Medium. You can also search for the project name + ‘audit report’.
Q: Is a single audit enough?
For high-value projects, multiple audits from different firms are recommended. One audit may not catch everything.
Conclusion
Reading a smart contract audit report is a critical skill for any crypto investor. By understanding the key sections, severity levels, and red flags, you can better assess the security of a project before committing funds. Always combine audit analysis with other due diligence, such as team background checks and community reputation.
For more details on this, check out our guide on Master Fibonacci Retracement Entries: Pinpoint Precision for Your Trades.
You might also be interested in reading about Ethereum vs Solana Ratio Trading: How to Profit from the Battle of the Blockchains.
Bitcoin Halving Cycles Explained: Why Moonshot Predictions May Be Over
Did you know that Bitcoin’s price multiplied by 75 times during its 2013 cycle, but only 1.8 times in its most recent 2025 run? This dramatic slowdown challenges popular forecasts predicting Bitcoin could reach $300,000 to $500,000 by 2029. For crypto investors, understanding this trend is crucial for setting realistic expectations. As Bitcoin matures and attracts institutional investors, the era of parabolic “moonshot” rallies may be ending. This guide explains how Bitcoin’s four-year halving cycles work, why each cycle produces smaller gains than the last, and what this means for your investment strategy in 2026 and beyond.
Read time: 8-10 minutes
Understanding Bitcoin Halving Cycles for Beginners
Bitcoin halving cycles are the four-year market patterns driven by a programmed event that cuts Bitcoin’s mining rewards in half. Think of it like a company automatically reducing its stock issuance by 50% every four years—it creates scarcity, which historically has pushed prices higher over time.
Why was this created? Bitcoin’s creator, Satoshi Nakamoto, designed the halving to control inflation and mimic the scarcity of precious metals like gold. Unlike central banks that can print unlimited money, Bitcoin’s supply is capped at 21 million coins, and halvings ensure new coins enter circulation at a steadily decreasing rate.
A real-world example: The first halving in 2012 cut mining rewards from 50 BTC to 25 BTC per block. Within a year, Bitcoin’s price surged from around $12 to over $1,000. The fifth halving is scheduled for April 2028, which will reduce rewards from 3.125 BTC to 1.5625 BTC per block.
The Technical Details: How Bitcoin Halving Cycles Actually Work
Bitcoin’s price tends to follow a predictable pattern around each halving. Here’s how the cycle typically unfolds:
1. Pre-Halving Bottom (18 months before): Prices usually reach their lowest point about 18 months before the halving. This is when bear market sentiment is strongest.
2. Halving Event (Day zero): Mining rewards are cut in half. This doesn’t immediately spike prices, but it reduces the new supply entering the market.
3. Post-Halving Rally (16-18 months after): The bull run typically peaks about 16-18 months after the halving, driven by the cumulative effect of reduced supply.
4. Bear Market Decline (12 months after peak): Prices then fall for roughly a year before the cycle restarts.
Why this structure matters for you: Understanding this timeline helps you identify when we’re in a bull or bear phase. The next cycle peak, based on the April 2028 halving, is expected around mid-to-late 2029. This gives investors a clear timeframe for strategic planning—not timing the exact top, but understanding market phases.
> Visual suggestion: Flow diagram showing the four phases of a Bitcoin halving cycle—bottom, halving, peak, and decline—with approximate timeframes.
Current Market Context: Why This Matters Now
As of July 2026, Bitcoin is trading around $64,000, well below its 2025 peak of $126,000. The market is in a bearish phase following the 2024-2025 cycle, and analysts are already forecasting the next bull run.
However, the data tells a sobering story. Here’s how Bitcoin’s peak-to-peak multiples have shrunk with each cycle:
| Cycle | Peak Price | Multiple from Previous Peak |
|---|---|---|
| 2013 | $266 | – (Starting point) |
| 2017 | ~$20,000 | 75x |
| 2021 | ~$69,000 | 3.5x |
| 2025 | ~$126,000 | 1.8x |
If this trend continues, the next cycle peak could be well below the $300,000 to $500,000 forecasts. A rally to $300,000 would require a 2.4x multiple from the 2025 high—significantly higher than the previous cycle’s 1.8x.
Veteran trader Peter Brandt and Bernstein analysts have predicted $300,000-$500,000 targets, citing ETF demand and institutional adoption. But the math suggests these forecasts may be overly optimistic.
Competitive Landscape: How Bitcoin’s Maturity Compares
Bitcoin’s slowing returns reflect its transition from a speculative asset to a mature market. Here’s how it compares:
| Feature | Bitcoin (Now) | Bitcoin (2017) | Traditional Assets (Gold, S&P 500) |
|---|---|---|---|
| Market Cap | ~$1.2 trillion | ~$300 billion | Gold: ~$15 trillion |
| Daily Volume | $20-30 billion | $5-10 billion | Gold: $100+ billion |
| Volatility | Moderate (40-60% annual) | Extreme (100%+ annual) | Low (15-20% annual) |
| Institutional Access | ETFs, futures, options | Limited futures | Full institutional infrastructure |
| Price Predictability | More measured cycles | Manic-depressive swings | Generally stable |
Why this matters: Bitcoin is becoming “Wall Street-ized.” The same factors that make it more stable—ETFs, institutional trading, risk management tools—also limit its ability to produce the massive percentage gains of its early years.
Practical Applications: Real-World Use Cases
How should investors use halving cycle knowledge in 2026?
- Realistic Return Expectations: Instead of expecting 10x-100x gains, plan for 1.5x-2.5x returns per cycle. This helps avoid disappointment and reckless risk-taking.
- Cycle-Based Dollar-Cost Averaging: Accumulate during bear markets (like now) and take profits during bull runs. Knowing the cycle phase helps you make disciplined decisions.
- Risk Management: As volatility decreases, position sizes can be larger without extreme drawdown risk, but leverage should be minimal.
- Portfolio Allocation: Bitcoin may now be a “slow-growth” asset suitable for 5-10% of a diversified portfolio, rather than a high-risk moonshot bet.
Risk Analysis: Expert Perspective
Primary Risks:
1. Overly Optimistic Forecasts: Relying on $300,000-$500,000 predictions could lead to holding through a peak that never materializes.
2. Institutional Flow Reversal: ETF demand drove the 2025 peak. If institutional interest wanes, the next cycle might underperform even 1.8x.
3. Regulatory Headwinds: SEC actions, tax policy changes, or a potential U.S. CBDC ban could suppress demand.
Mitigation Strategies:
- Use historical cycle data (not predictions) as your primary planning tool.
- Set specific sell targets based on realistic multiples (e.g., 1.5x-2x from bear market lows).
- Maintain a cash reserve to buy during the next bear market bottom.
Expert Consensus: The consensus among data-driven analysts is that Bitcoin’s growth is slowing, not stopping. Even without moonshots, a measured rally to $150,000-$200,000 by 2029 would represent healthy returns.
Future Outlook: What’s Next
Bitcoin’s next major cycle is expected to begin with the April 2028 halving. Here’s what to watch:
1. ETF Flow Patterns: Continued institutional inflows through ETFs could provide steadier demand than retail-driven cycles.
2. Macro Economic Context: A potential Federal Reserve stimulus could boost all risk assets, including Bitcoin, in the 2028-2029 timeframe.
3. U.S. Reserve Asset Debate: If the Treasury buys BTC as a reserve asset, it could supercharge demand—but this remains speculative.
4. Diminishing Returns Trend: The data suggests the next peak will be between $150,000 and $200,000, not $300,000-$500,000.
The era of “moonshots” defined by 75x and 3.5x returns appears to be history. Bitcoin is becoming larger, more liquid, and less volatile—moving toward its destiny as “digital gold” with steady, reliable growth.
Key Takeaways
- Bitcoin halving cycles produce diminishing returns as the asset matures, with peak-to-peak multiples shrinking from 75x (2013) to just 1.8x (2025).
- The $300,000-$500,000 forecasts for 2029 are overly optimistic given historical data; a more realistic target is $150,000-$200,000.
- Bitcoin’s institutionalization through ETFs and derivatives makes it less volatile but also limits its upside percentage gains.
- Investors should set realistic expectations using cycle data and dollar-cost average during bear markets for the best risk-adjusted returns.
How to Bridge Assets Across Blockchains Safely: A Step-by-Step Guide for 2025
Bridging assets across blockchains is a fundamental skill for any crypto user who wants to move tokens between networks like Ethereum, BNB Chain, Polygon, or Solana. However, cross-chain transfers come with risks such as smart contract vulnerabilities, bridge hacks, and high fees. This guide will walk you through the safest methods, key concepts, and pro tips to protect your funds.
Key Concepts
- Cross-Chain Bridge: A protocol that locks tokens on one blockchain and mints equivalent tokens on another. Examples include Wormhole, Multichain, and Stargate.
- Wrapped Tokens: Tokens like WETH or WBTC that represent an asset from another chain. Always verify the official contract address.
- Liquidity Pools: Bridges rely on liquidity providers. Choose bridges with deep liquidity to avoid slippage and failed transactions.
- Security Audits: Only use bridges that have been audited by reputable firms like CertiK, Trail of Bits, or OpenZeppelin.
- Transaction Finality: Understand that some chains (e.g., Bitcoin) have slower finality. Wait for sufficient confirmations before considering a transfer complete.
Pro Tips
- Start with a small test transaction – Always send a tiny amount first to verify the bridge works and you have the correct destination address.
- Check the bridge’s TVL (Total Value Locked) – A higher TVL generally indicates more trust and liquidity.
- Avoid bridging during network congestion – Gas fees spike during peak times. Use tools like Etherscan Gas Tracker to pick low-fee windows.
- Use a dedicated wallet – Consider using a hardware wallet or a separate hot wallet for bridging activities to limit exposure.
- Double-check contract addresses – Scammers often create fake tokens. Always verify the official token address on the destination chain.
FAQ Section
What is the safest bridge to use?
There is no single safest bridge, but generally, bridges with multiple audits, a long track record, and high TVL (like Stargate or Wormhole) are considered more secure. Always do your own research.
How long does a cross-chain bridge take?
It varies by network. Ethereum to Polygon can take 10–30 minutes, while Solana to Ethereum might take 5–15 minutes. Delays can occur during congestion.
Can I lose my funds when bridging?
Yes, risks include smart contract bugs, bridge hacks, or sending to the wrong address. Always triple-check the destination address and use a test transaction.
Do I need native gas tokens on the destination chain?
Yes, you typically need the native token (e.g., ETH on Ethereum, MATIC on Polygon) to pay for transaction fees on the destination chain. Some bridges offer a gas fee service, but it’s safer to have a small amount ready.
Conclusion
Bridging assets across blockchains is a powerful tool for accessing DeFi, NFTs, and lower fees, but it requires caution. Always prioritize security over speed: use audited bridges, start with small test transactions, and keep your private keys safe. For more details on this, check out our guide on Risk Management 101: The 1% Rule Explained for Safer Trading. You might also be interested in reading about How to Secure Your Crypto Wallet: A Step-by-Step Guide.
US Treasury Bills on Blockchain: The Risk-Free Rate On-Chain
Tokenized US Treasury bills are reshaping how investors access the risk-free rate. By bringing government debt onto a blockchain, these instruments combine the safety of traditional finance (TradFi) with the efficiency and transparency of decentralized finance (DeFi). This guide explains what tokenized T-bills are, how they work, and what risks and rewards they offer.
What Are Tokenized US Treasury Bills?
Tokenized US Treasury bills are digital representations of short-term US government debt obligations. Each token represents a fractional ownership of an underlying T-bill held by a special purpose vehicle (SPV). Unlike traditional T-bills that trade only during market hours and settle in days, tokenized versions can be traded 24/7 on blockchain networks, with near-instant settlement.
The key difference between off-chain and on-chain T-bills is liquidity and accessibility. Off-chain T-bills require a brokerage account, minimum investments, and are subject to market hours. On-chain T-bills can be bought with stablecoins, have lower minimums, and offer continuous liquidity through decentralized exchanges (DEXs) or automated market makers.
How It Works: The Technical Process
The process of bringing US Treasury bills on-chain involves several steps:
- Tokenization: A regulated issuer (e.g., Ondo Finance, Backed Finance) creates a smart contract that mints tokens representing fractional ownership of a T-bill.
- Special Purpose Vehicle (SPV): The issuer sets up an SPV that holds the actual T-bills in a custodial account. The SPV ensures legal separation between the issuer’s assets and the token holders’ assets.
- Oracle Integration: Price oracles (e.g., Chainlink) feed the net asset value (NAV) of the underlying T-bills to the blockchain, ensuring token prices reflect real-world values.
- Blockchain Settlement: Investors buy tokens using stablecoins (USDC, USDT) on networks like Ethereum, Polygon, or Solana. The tokens can be transferred, traded, or used as collateral in DeFi protocols.
Investment Analysis: Pros, Cons, and Risks
Pros
- Accessibility: Low minimum investments (sometimes as low as $1) allow retail investors to access institutional-grade yields.
- 24/7 Liquidity: Tokens can be traded at any time, unlike traditional T-bills that only trade during market hours.
- Transparency: All transactions are recorded on a public blockchain, providing real-time auditability.
- Yield: Tokenized T-bills typically pass through the yield of the underlying T-bill, minus management fees (often 0.15%–0.50%).
Cons
- Regulatory Uncertainty: The legal status of tokenized securities varies by jurisdiction. The SEC has not yet provided clear guidance on all tokenized products.
- Smart Contract Risk: Bugs or exploits in the token contract could lead to loss of funds. Audits by firms like Trail of Bits or Certik are essential but not foolproof.
- Custodial Risk: The SPV holding the T-bills relies on a custodian. If the custodian fails or commits fraud, token holders may not have direct recourse.
For a broader market view, check out our analysis on How to Participate in Governance Proposals (DAOs): A Complete Guide for 2026.
Investors often compare this to Using Etherscan: Tracking Whales and Verifying Transactions – The Ultimate Guide.
Tool Recommendation
Looking for altcoin opportunities and smooth trading? Try KuCoin. KuCoin offers a wide range of tokenized assets and stablecoin pairs, making it easy to trade and manage your on-chain T-bill exposure. Start trading on KuCoin today.
FAQ Section
What is the yield on tokenized US Treasury bills?
Yield varies based on the current US Treasury rate. As of early 2025, short-term T-bills yield approximately 4.5%–5.0% APY. Tokenized products pass this yield to token holders after deducting management fees (typically 0.15%–0.50%). Always check the specific product’s prospectus for exact terms.
Are tokenized T-bills considered securities?
Yes, in most jurisdictions tokenized T-bills are classified as securities because they represent ownership of an underlying investment contract. Issuers must comply with securities laws, including registration or exemption requirements. Investors should verify the regulatory status of any tokenized product before purchasing.
How do I redeem tokenized T-bills for fiat currency?
Redemption processes vary by issuer. Most tokenized T-bills can be redeemed by burning the tokens on the blockchain, after which the issuer sends the equivalent fiat (or stablecoin) to your wallet. Redemption may take 1–5 business days, depending on the issuer’s settlement procedures. Some products also offer instant redemption through liquidity pools, but this may incur a small fee.
Conclusion
Tokenized US Treasury bills represent a significant step forward in bridging TradFi and DeFi. They offer retail and institutional investors a way to earn the risk-free rate with the benefits of blockchain technology: 24/7 liquidity, fractional ownership, and transparency. However, investors must remain aware of regulatory, smart contract, and custodial risks. As the ecosystem matures and regulation becomes clearer, tokenized T-bills could become a cornerstone of on-chain finance.