
Master the Market’s Language: A Beginner’s Guide to Japanese Candlestick Patterns
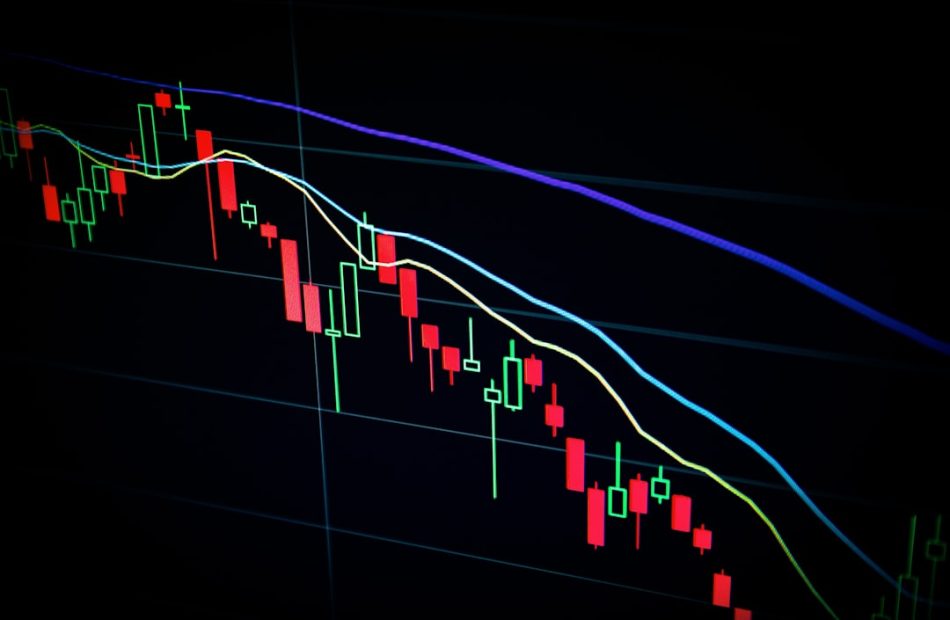
Imagine being able to read the market’s mind. That’s the power of Japanese candlestick patterns. These ancient charts, developed by rice traders in 18th-century Japan, are the modern trader’s secret weapon. They’re not just pretty shapes—they’re a visual story of the battle between buyers and sellers. In this guide, you’ll learn how to spot the most reliable patterns and use them to make smarter trading decisions.
How It Works
Every candlestick tells a story. The body shows the opening and closing price, while the wicks (or shadows) reveal the high and low. A green (or hollow) body means buyers won—the close was higher than the open. A red (or filled) body means sellers took control. But the real magic happens when you look at groups of candles. Patterns form, and these patterns hint at what might come next. It’s like reading footprints in the sand—you can see where the market has been and predict where it’s heading.
Looking for altcoin opportunities and smooth trading? Try KuCoin.
The Setup: Key Patterns to Know
Let’s dive into the patterns that every trader should have in their toolkit. We’ll start with the classics—the ones that have stood the test of time.
Bullish Reversal Patterns (Catch the Bottom)
Hammer: A small body at the top with a long lower wick. It appears after a downtrend and signals that sellers pushed prices down, but buyers fought back and won. The long wick is the battle scar. If you see a hammer, the market might be ready to turn upward.
Bullish Engulfing: This is a two-candle pattern. The first is a red candle, the second is a big green candle that completely ‘engulfs’ the first. It shows that buyers have overwhelmed sellers—a strong sign of a reversal. Look for this at the end of a downtrend.
Morning Star: A three-candle pattern. The first is a long red candle (sellers in control), the second is a small candle (indecision), and the third is a long green candle (buyers take over). It’s like a sunrise after a dark night—hope is on the horizon.
Bearish Reversal Patterns (Spot the Top)
Shooting Star: The opposite of a hammer. A small body at the bottom with a long upper wick. It appears after an uptrend and signals that buyers pushed prices up, but sellers fought back and won. The market might be ready to fall.
Bearish Engulfing: The mirror image of the bullish engulfing. A green candle followed by a big red candle that engulfs it. Sellers have taken control—time to consider selling.
Evening Star: The opposite of the morning star. A long green candle, a small indecision candle, then a long red candle. It’s like a sunset—the day is over, and night is coming.
Continuation Patterns (The Trend Continues)
Doji: A candle with a very small body—the open and close are nearly the same. It shows indecision. When it appears during a trend, it can mean a pause, but the trend often continues. It’s a warning to watch closely.
Three White Soldiers: Three long green candles in a row, each closing higher. It shows strong buying pressure and often means the uptrend will continue.
Three Black Crows: Three long red candles in a row, each closing lower. It shows strong selling pressure and often means the downtrend will continue.
How to Use These Patterns in Your Trading
Patterns are powerful, but they’re not magic. Always confirm with other indicators. For example, if you see a hammer, check the volume—was it high? High volume adds credibility. Also, look at the bigger picture. A pattern on a 5-minute chart is less reliable than one on a daily chart. And remember: patterns work best when they appear at key support or resistance levels. That’s where the market is most likely to reverse.
Risk Management: Your Safety Net
Even the best patterns fail sometimes. That’s why risk management is non-negotiable. Here’s how to stay safe:
- Set a Stop-Loss: Always place a stop-loss just below the pattern’s low (for bullish patterns) or above the pattern’s high (for bearish patterns). This limits your loss if the market goes against you.
- Position Sizing: Never risk more than 1-2% of your trading capital on a single trade. This ensures one bad trade won’t wipe you out.
- Use a Risk-Reward Ratio: Aim for at least a 1:2 ratio. If you risk $50, your target should be at least $100. This way, you only need to be right half the time to be profitable.
- Don’t Overtrade: Wait for high-quality setups. If the pattern isn’t clear, skip it. Patience is a trader’s best friend.
Conclusion
Japanese candlestick patterns are a window into the market’s soul. They give you an edge, but they’re not a crystal ball. Combine them with solid risk management, and you’ll be well on your way to trading with confidence. Start by practicing on a demo account, and soon you’ll be reading the market’s story like a pro. Remember, every expert was once a beginner—keep learning, stay disciplined, and the patterns will reveal their secrets to you.