Mastering Japanese Candlestick Patterns: The Trader’s Visual Language
Imagine being able to glance at a chart and instantly read the emotional battle between buyers and sellers. That’s exactly what Japanese candlestick patterns allow you to do. Developed by rice traders in 18th-century Japan, these patterns have stood the test of time and remain one of the most reliable tools for predicting price movements. Whether you’re a beginner or an intermediate trader, learning candlestick patterns is like unlocking a secret code to the market’s next move.
How It Works
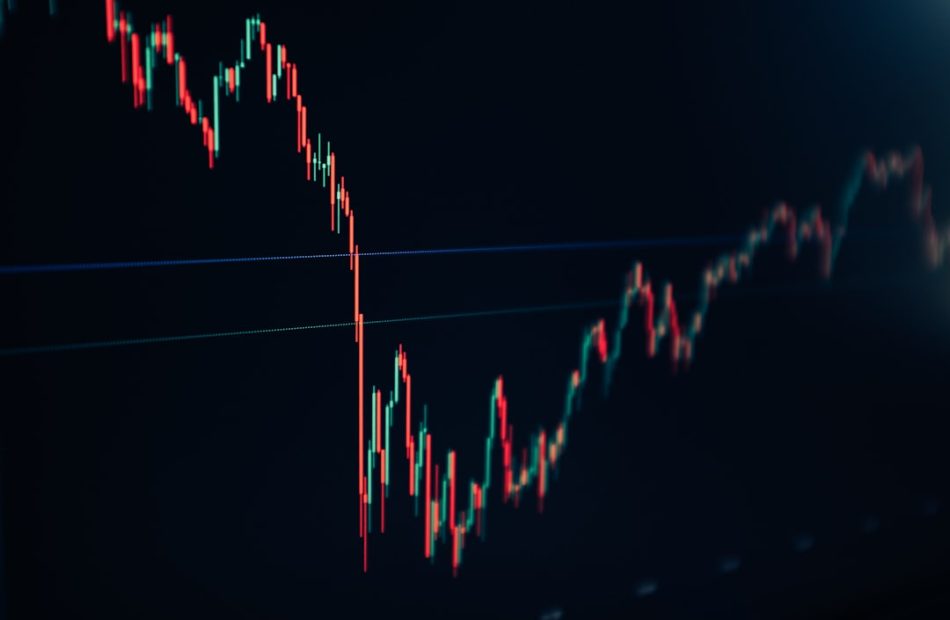
Each candlestick represents a specific time period (e.g., 1 hour, 1 day). The body shows the opening and closing prices, while the wicks (or shadows) show the high and low. The color tells you whether the price closed higher (bullish, often green/white) or lower (bearish, often red/black). But the real magic happens when you combine multiple candles into recognizable patterns.
The Setup
Here are three essential patterns every trader should know:
1. Doji – This pattern forms when the opening and closing prices are nearly equal, creating a small body with long wicks. It signals indecision in the market. A Doji after a strong uptrend or downtrend often warns of a potential reversal.
2. Hammer and Shooting Star – Both have small bodies and long lower wicks. A Hammer appears during a downtrend and suggests a bullish reversal. A Shooting Star appears during an uptrend and suggests a bearish reversal. Look for these at key support or resistance levels for higher probability trades.
3. Engulfing Pattern – This is a two-candle pattern. A bullish engulfing pattern occurs when a small bearish candle is followed by a larger bullish candle that fully “engulfs” it. A bearish engulfing pattern is the opposite. It signals strong momentum in the direction of the engulfing candle.
To trade these patterns, wait for the pattern to fully form (the close of the last candle). Then enter a trade in the direction of the pattern’s signal. For example, after a bullish engulfing pattern, you might go long with a stop loss below the low of the pattern.
Risk Management
No pattern is 100% accurate. Always use a stop loss to protect your capital. A good rule is to place your stop just below the low of a bullish pattern or just above the high of a bearish pattern. Also, never risk more than 1–2% of your account on a single trade. Combine candlestick patterns with other tools like support/resistance or trendlines to increase your odds.
Conclusion
Japanese candlestick patterns give you a clear, visual edge in the markets. Start by practicing on a demo account, focus on a few key patterns, and always manage your risk. Over time, you’ll develop an intuitive feel for price action. Happy trading, and remember – every candle tells a story.