
Mastering the Art of Japanese Candlestick Patterns: Your First Step to Reading Market Psychology
Have you ever looked at a price chart and felt like you were missing a secret language? If so, you’re not alone. For centuries, Japanese rice traders used a simple yet powerful visual tool to track price movements—and today, we call them candlestick charts. In this post, we’ll demystify the most essential Japanese candlestick patterns, showing you how to read market sentiment like a pro. By the end, you’ll spot bullish and bearish signals with confidence, turning chaotic price action into a clear story of supply and demand.
How It Works
Every candlestick tells a story. The body represents the open-to-close range, while the wicks (or shadows) show the high and low. But the real magic lies in patterns—groups of one, two, or three candles that reveal the emotional battle between buyers and sellers. When you learn to recognize these formations, you start seeing where the market is likely to reverse or continue its trend.
The Setup: Key Candlestick Patterns You Need to Know
Let’s break down the most reliable patterns for beginners and intermediate traders alike.
Looking for altcoin opportunities and smooth trading? Try KuCoin.
1. Single-Candle Patterns
- Doji: A candle with a tiny body, where open and close are nearly equal. It signals indecision. A Doji after a strong uptrend warns of a potential reversal; after a downtrend, it hints at a bottom.
- Hammer: A small body with a long lower wick (at least twice the body). Found at the end of a downtrend, it suggests buyers are stepping in to push prices back up. The long wick shows rejection of lower prices.
- Shooting Star: The opposite of a Hammer—a small body with a long upper wick, appearing after an uptrend. It indicates sellers are taking control, and a bearish reversal may follow.
2. Two-Candle Patterns
- Bullish Engulfing: A small red (bearish) candle is followed by a larger green (bullish) candle that completely ‘engulfs’ the previous body. This signals a strong shift from selling to buying pressure.
- Bearish Engulfing: The reverse—a small green candle followed by a larger red candle that engulfs it. This warns of a potential top and a move lower.
- Piercing Line: In a downtrend, a red candle is followed by a green candle that opens lower but closes above the midpoint of the previous red candle. It shows buyers are gaining strength.
- Dark Cloud Cover: The bearish cousin of the Piercing Line. A green candle is followed by a red candle that opens higher but closes below the midpoint of the previous green candle. Expect selling pressure.
3. Three-Candle Patterns
- Morning Star: A three-candle reversal pattern at the bottom of a downtrend. First is a long red candle, then a small-bodied candle (Doji or spinning top) that gaps down, and finally a long green candle that closes well into the first red candle. This is a powerful bullish signal.
- Evening Star: The bearish version. A long green candle, a small-bodied candle that gaps up, followed by a long red candle that closes deep into the first green. Watch for a trend reversal to the downside.
- Three White Soldiers: Three consecutive long green candles, each closing higher than the previous. This indicates strong, sustained buying pressure and a continuation of an uptrend.
- Three Black Crows: Three consecutive long red candles, each closing lower than the last. This signals aggressive selling and a potential continuation of a downtrend.
Putting It All Together: A Simple Trading Setup
1. Identify the trend: Use a moving average or trendline to confirm whether the market is trending up, down, or sideways.
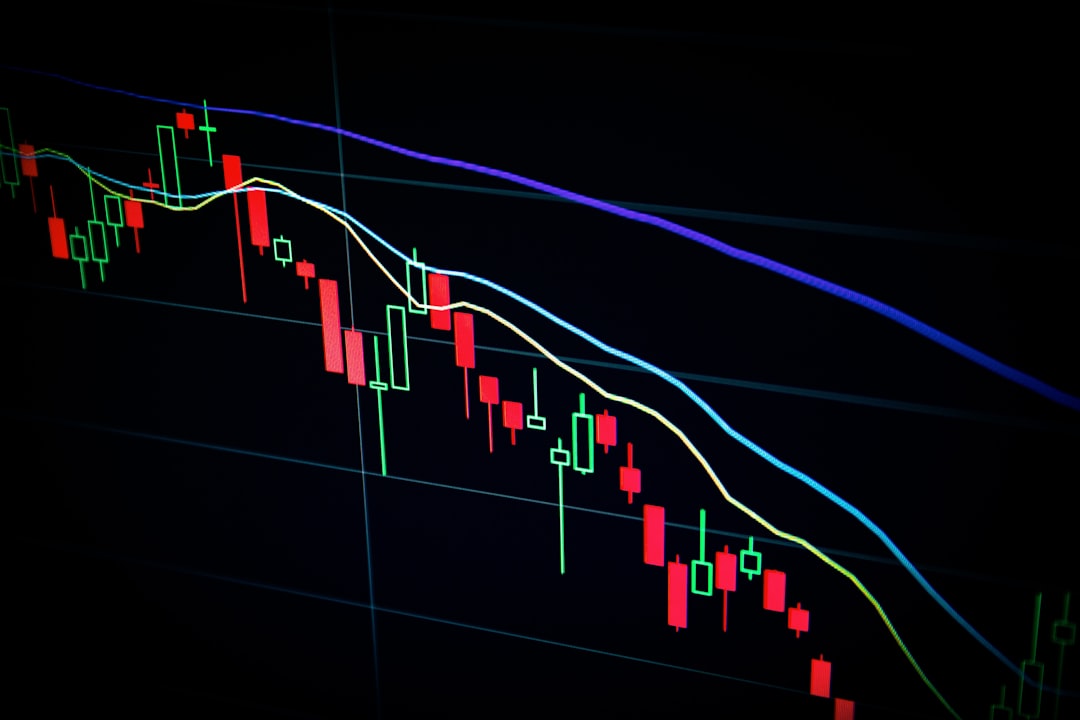
2. Wait for a key pattern: Look for a reversal pattern (like Hammer, Engulfing, or Morning Star) at a support level in an uptrend, or at a resistance level in a downtrend.
3. Confirm with volume: Higher volume on the pattern candle adds credibility. For example, a Bullish Engulfing with above-average volume is much stronger.
4. Enter the trade: Place a buy order above the high of the pattern candle (for bullish setups) or a sell order below the low (for bearish setups).
Risk Management: Protecting Your Capital
Even the most beautiful candlestick pattern can fail. Here’s how to stay safe:
- Set a stop-loss: For bullish patterns, place your stop below the lowest wick of the pattern. For bearish patterns, place it above the highest wick.
- Risk only 1-2% per trade: Never risk more than a small portion of your account on any single setup.
- Look for confluence: Combine patterns with other indicators like RSI or MACD, or with support/resistance levels. The more evidence, the better.
- Don’t chase: If the price has already moved far past your entry point, wait for the next opportunity. Patience is a trader’s superpower.
Conclusion
Japanese candlestick patterns are not just pretty shapes—they are a window into the collective psychology of the market. By learning to read these patterns, you gain an edge in anticipating price movements before they happen. Start by practicing on a demo account, focus on just a few patterns (like Engulfing and Doji), and gradually expand your toolkit. Remember, no pattern is 100% accurate, but combined with solid risk management, they can transform your trading from guesswork to a disciplined art. Happy trading!