
Mastering the Head and Shoulders Pattern: A Trader’s Guide to Reversals
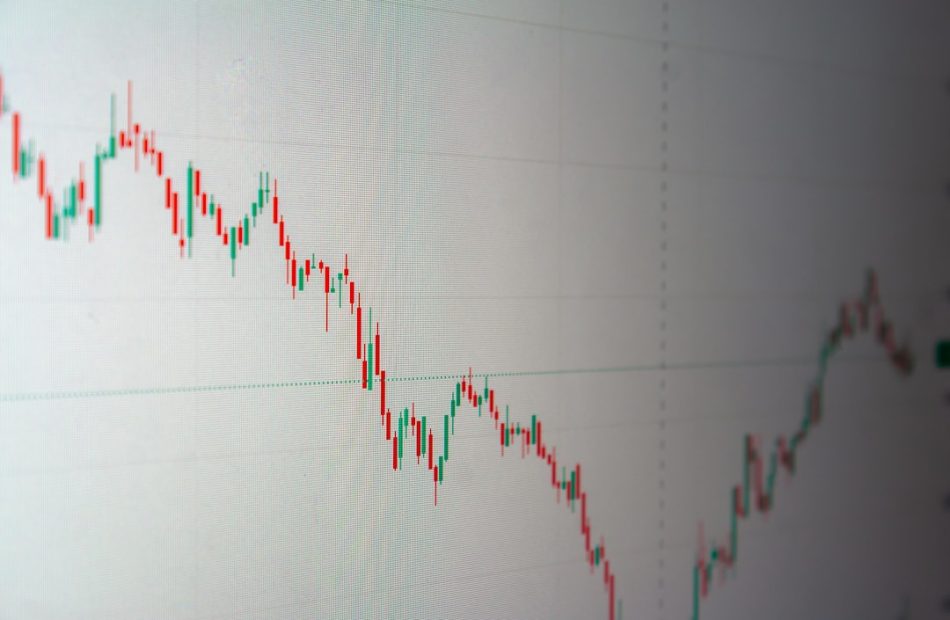
Imagine looking at a chart and seeing a pattern that whispers, ‘The trend is about to change.’ That’s the power of the Head and Shoulders pattern. It’s one of the most reliable reversal patterns in technical analysis, and once you learn to spot it, you’ll never look at a market the same way again. Whether you’re trading Bitcoin, stocks, or forex, this pattern can help you catch major trend reversals early. Let’s dive in and demystify this classic setup.
How It Works
The Head and Shoulders pattern is a bearish reversal pattern that forms after an uptrend. It looks like a baseline with three peaks: the left shoulder, a higher head, and a right shoulder. The two valleys between these peaks form a support level called the ‘neckline.’ When the price breaks below the neckline, it signals that the bullish trend has ended and a bearish trend may begin.
But why does it work? It’s all about market psychology. The left shoulder forms as buyers push price to a new high, but sellers step in and pull it back. The head forms when buyers try again, pushing price even higher, but sellers are stronger this time, causing a deeper pullback. The right shoulder forms when buyers make one last attempt, but they fail to reach the previous high, showing that momentum is fading. When the neckline breaks, it confirms that sellers have taken control.
Looking for altcoin opportunities and smooth trading? Try KuCoin.
The Setup
To trade this pattern, you need to identify the key components:
1. Uptrend: The pattern must appear after a clear uptrend.

2. Left Shoulder: A peak followed by a pullback.
3. Head: A higher peak followed by a pullback to the neckline.
4. Right Shoulder: A lower peak (compared to the head) followed by a pullback.
5. Neckline: The support level connecting the two pullback lows. It can be horizontal or slightly sloped.
Once the right shoulder is formed and price breaks below the neckline, you have your entry signal. The break should be on increased volume for confirmation. The target is measured by the distance from the head’s peak to the neckline, projected downward from the breakout point. For example, if the head is 100 points above the neckline, you’d aim for a 100-point drop from the neckline.
Risk Management
Risk management is crucial when trading any pattern, and the Head and Shoulders is no exception. Here are some key rules:
- Stop-Loss: Place your stop-loss just above the right shoulder’s high. This gives you a clear exit if the pattern fails.
- Position Sizing: Never risk more than 1-2% of your trading capital on a single trade. Adjust your position size based on the distance to your stop-loss.
- Confirmation: Wait for a close below the neckline, not just an intraday dip. This reduces false breakouts.
- Market Context: The pattern is more reliable on higher timeframes (daily, weekly) and when it forms at the end of a strong trend. Avoid trading against the overall market trend.
Remember, no pattern is 100% accurate. Sometimes the price will break the neckline and then reverse back above it. That’s why your stop-loss is your best friend. Always plan your trade before you enter, and stick to your plan.
Conclusion
The Head and Shoulders pattern is a powerful tool in any trader’s arsenal. It gives you a clear, visual signal that a trend is likely to reverse, allowing you to enter the market with confidence. By understanding the psychology behind it, identifying the setup correctly, and managing your risk, you can turn this classic pattern into a consistent edge. So next time you’re analyzing a chart, keep an eye out for those three peaks—they might just be telling you where the market is headed next. Happy trading!