
Mastering the Market’s Secret Language: A Beginner’s Guide to Japanese Candlestick Patterns
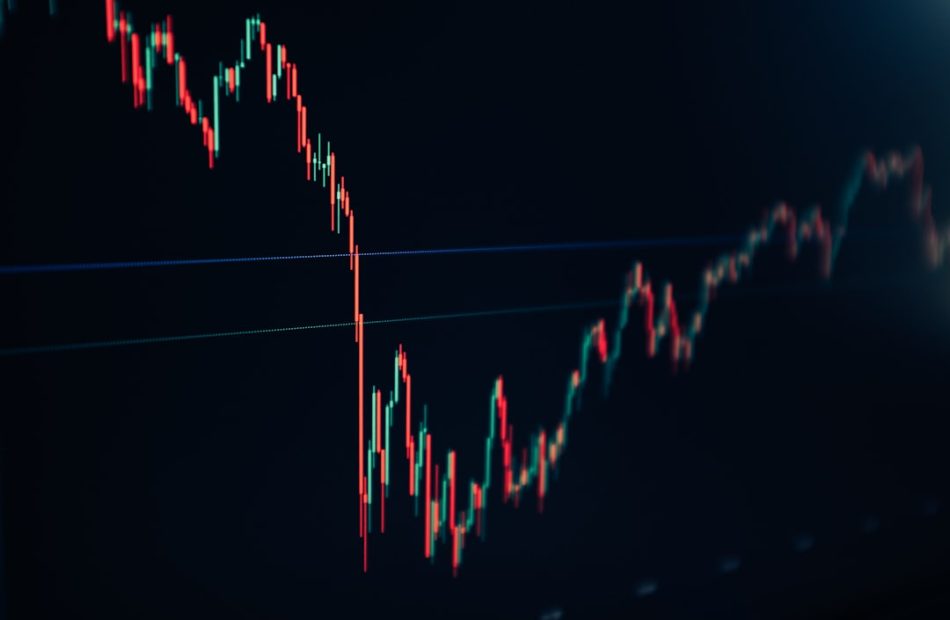
Imagine being able to glance at a chart and instantly understand the emotional tug-of-war between buyers and sellers. That’s the superpower Japanese candlestick patterns give you. Developed centuries ago by rice traders in Japan, these visual signals are still the foundation of modern technical analysis. Whether you’re a complete beginner or looking to sharpen your edge, this guide will help you decode the market’s secret language.
How It Works
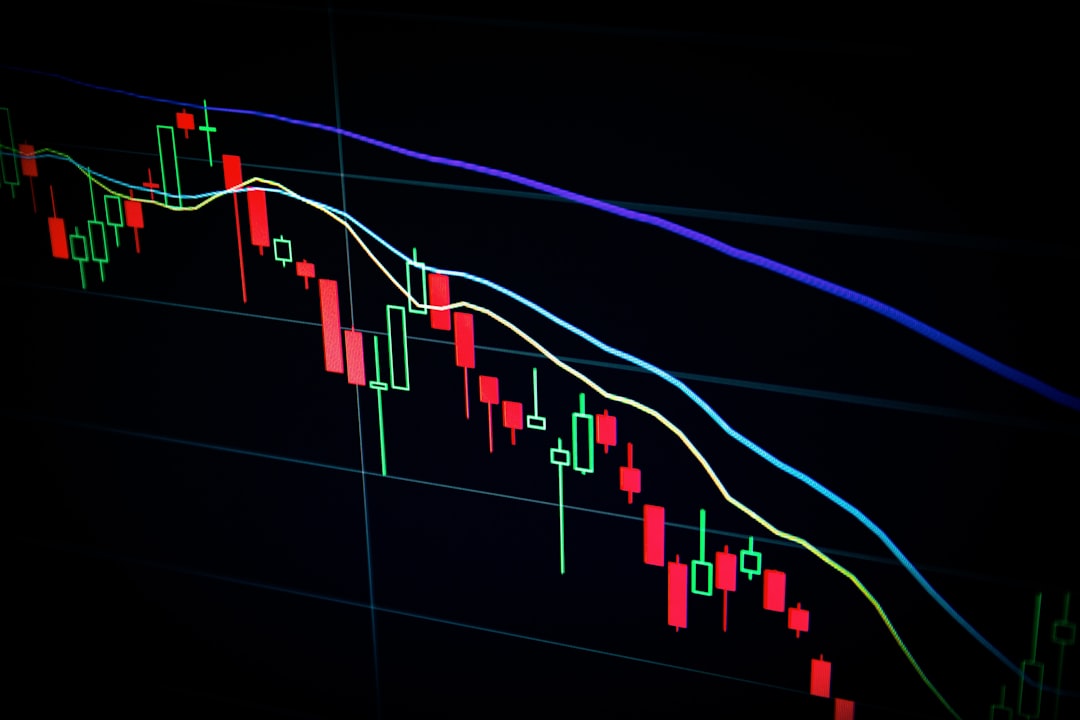
Each candlestick tells a story. The body shows the opening and closing price, while the wicks (or shadows) reveal the high and low. A green (or white) body means the price closed higher than it opened—bullish. A red (or black) body means it closed lower—bearish. But the real magic happens when you spot patterns formed by two or more candles. These patterns signal potential reversals or continuations in the market.
The Setup
Here are three essential patterns every trader should know:
1. The Hammer (Bullish Reversal)
- Appearance: A small body at the top with a long lower wick (at least twice the body length).
- Meaning: Sellers pushed the price down during the session, but buyers fought back and closed near the open. It often appears at the bottom of a downtrend, hinting at a potential reversal upward.
- How to trade: Wait for confirmation—a green candle closing above the hammer’s body. Enter long with a stop loss below the hammer’s low.
2. The Shooting Star (Bearish Reversal)
- Appearance: A small body at the bottom with a long upper wick.
- Meaning: Buyers drove the price up, but sellers took control and pushed it back down. This appears at the top of an uptrend and warns of a potential drop.
- How to trade: Wait for a red candle closing below the shooting star’s body. Enter short with a stop loss above its high.
3. The Engulfing Pattern (Strong Reversal)
- Appearance: A larger candle completely “engulfs” the previous smaller candle’s body.
- Bullish Engulfing: A green candle engulfs a red one. Buyers are taking over.
- Bearish Engulfing: A red candle engulfs a green one. Sellers are in charge.
- How to trade: Enter in the direction of the engulfing candle. For a bullish engulfing, go long with a stop below the low of the pattern. For bearish, go short with a stop above the high.
Risk Management
No pattern is 100% accurate. Always use a stop-loss order to protect your capital. A good rule of thumb is to risk no more than 1–2% of your account on any single trade. Also, look for patterns on higher timeframes (like 1-hour or daily charts)—they tend to be more reliable. Combine candlestick signals with support/resistance levels or trendlines for extra confirmation.
Conclusion
Japanese candlestick patterns give you a window into market psychology. By learning to spot the hammer, shooting star, and engulfing patterns, you’re not just reading lines on a chart—you’re reading the battle between fear and greed. Start practicing on a demo account, and soon these patterns will jump out at you like old friends. Happy trading!