
Mastering the RSI Divergence Strategy: Your Edge in Crypto
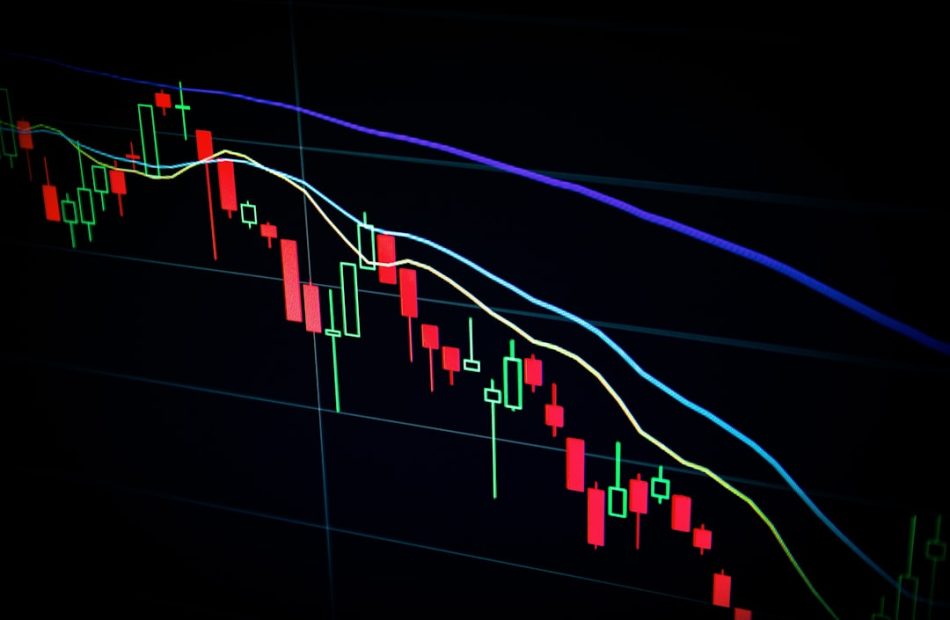
Have you ever watched a chart and felt like the price is lying to you? It pumps to new highs, but something feels off. That’s your first hint that a reversal might be brewing. In this post, we’re going to crack the code on one of the most reliable and exciting signals in technical analysis: the RSI Divergence Strategy. By the end, you’ll know exactly how to spot these hidden clues, avoid common pitfalls, and add a powerful weapon to your trading arsenal.
The Strategy Explained
What is RSI and Why Does It Matter?
The Relative Strength Index (RSI) is a momentum oscillator that measures the speed and change of price movements. It ranges from 0 to 100 and is typically plotted below the price chart. When RSI is above 70, the asset is considered overbought (potential for a pullback). When it’s below 30, it’s oversold (potential for a bounce). But the real magic happens when RSI and price tell different stories.
How It Works: The Hidden Signal
Divergence occurs when the price makes a new high or low, but the RSI does not. This mismatch signals that momentum is waning, and a reversal could be on the horizon. There are two types:
- Bullish Divergence: Price makes a lower low, but RSI makes a higher low. This suggests selling pressure is fading, and a move upward is likely.
- Bearish Divergence: Price makes a higher high, but RSI makes a lower high. This suggests buying pressure is weakening, and a move downward is probable.
Think of it like a runner sprinting – if their speed (RSI) is decreasing while they still manage to run a bit further (price), they’re about to tire out and slow down.

The Setup: Step-by-Step
1. Identify a Clear Trend: Divergence works best in a defined trend. Look for a strong uptrend or downtrend on a higher timeframe (like 4H or Daily).
2. Spot the Price Extreme: In an uptrend, wait for a new swing high. In a downtrend, wait for a new swing low.
3. Check the RSI: Look at the RSI value at that same moment. Does it make a corresponding higher low (in a downtrend) or lower high (in an uptrend)? If yes, you’ve found a divergence.
4. Confirm with Other Tools: Don’t rely on RSI alone. Look for support/resistance levels, candlestick patterns (like pin bars or engulfing), or volume changes to increase your confidence.
5. Enter the Trade: Once you see confirmation (e.g., a break of a trendline or a bullish/bearish candlestick pattern), enter in the direction of the anticipated reversal.
Risk Management
Divergence is not a crystal ball – it can fail, especially in strong trends. Here’s how to protect your capital:
- Always Use Stop-Losses: Place your stop-loss just beyond the extreme price point of the divergence. If the price continues against you, you’re out with a small loss.
- Position Sizing: Never risk more than 1-2% of your trading capital on a single trade. This ensures that a few losses won’t wipe you out.
- Wait for Confirmation: Avoid jumping in the moment you see divergence. Wait for a clear reversal signal to reduce false entries.
- Trade in the Direction of the Higher Timeframe: If you’re trading a 1H divergence, check the daily trend. If the daily is bullish, only take bullish divergences on the 1H.
- Be Patient: Sometimes divergence can persist for a long time. Don’t force a trade – wait for the right setup.
Conclusion
The RSI Divergence Strategy is a powerful tool that can give you a significant edge in the crypto markets. By understanding the subtle conversation between price and momentum, you can anticipate reversals before they happen. Remember, no strategy is perfect, but with solid risk management and practice, you can use divergence to improve your win rate and trade with greater confidence. Start by spotting divergences on your favorite coins, paper trade them, and then apply them to your live trading. The market is full of hidden messages – now you know how to read one of the most important ones.