
Reading the Market’s Mind: A Beginner’s Guide to Japanese Candlestick Patterns
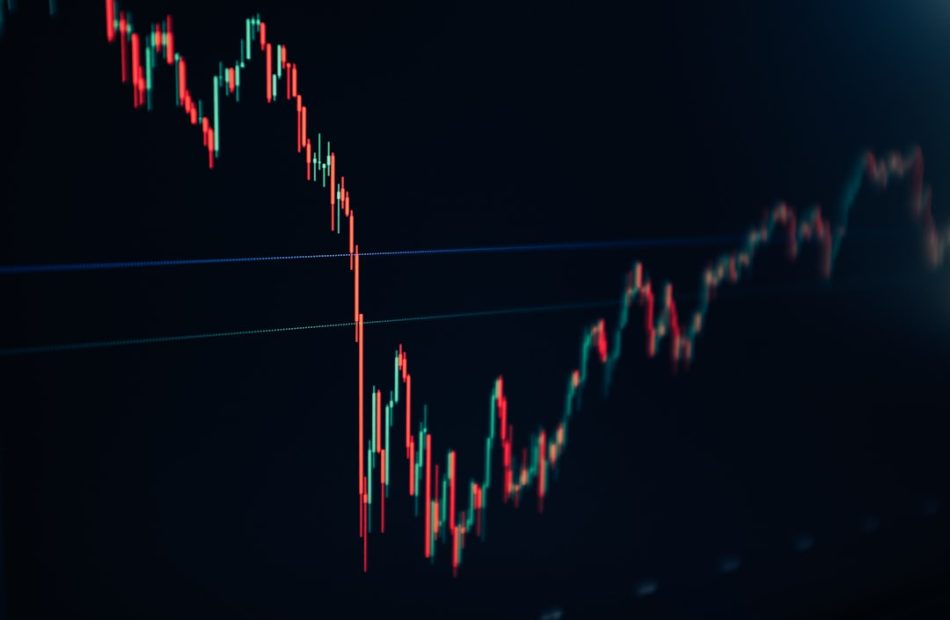
Imagine being able to glance at a chart and instantly know whether the bulls or the bears are in control. That’s the power of Japanese candlestick patterns. These ancient charting tools, developed by rice traders in 18th-century Japan, are still the most effective way to read market sentiment and predict short-term price movements. In this guide, we’ll break down the most powerful patterns you need to know, how to use them in your trading, and the golden rules of risk management that keep you safe.
How It Works
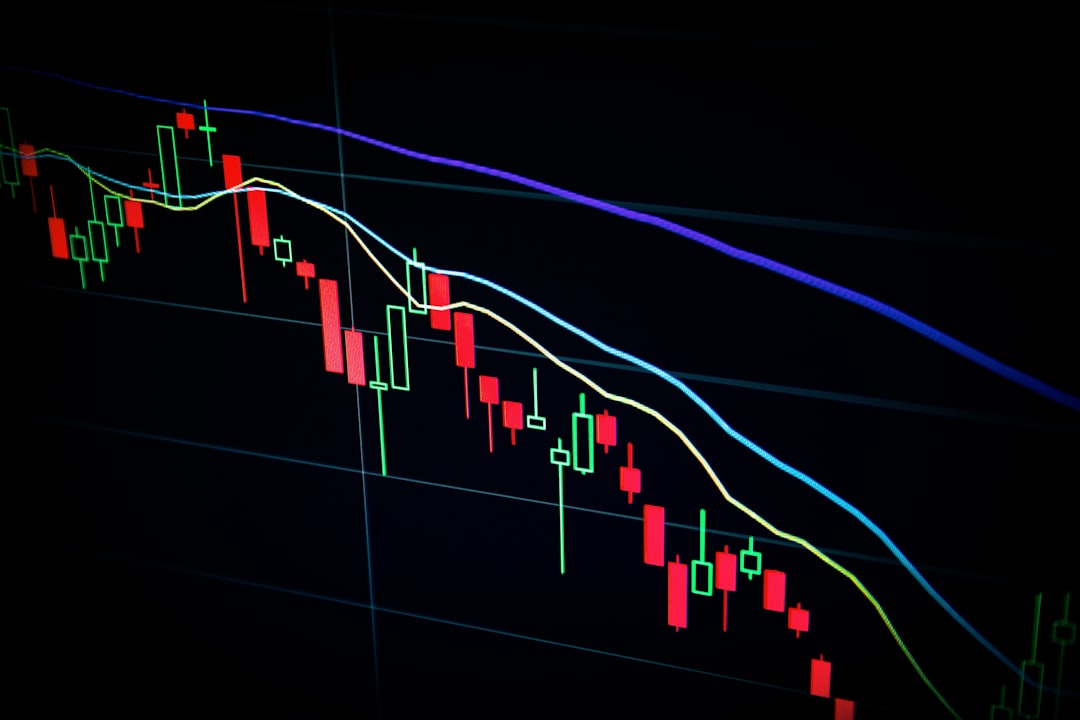
Candlesticks are more than just pretty colors on your screen. Each candle tells a story of the battle between buyers (bulls) and sellers (bears) over a specific time period. The body shows the opening and closing price, while the wicks (or shadows) show the high and low. A long green body means buyers dominated; a long red body means sellers took control. But the real magic happens when you spot patterns—specific formations that signal a likely reversal or continuation of the trend.
The Setup
Let’s dive into the most reliable patterns you’ll see on every chart. Remember, these work best on daily or 4-hour charts, and they’re even stronger when they appear at key support or resistance levels.
Bullish Reversal Patterns (Signs of a Bounce)
1. Hammer – A small body at the top of a long lower wick, appearing after a downtrend. It shows that sellers pushed prices down, but buyers fought back and closed near the open. This is a classic sign of a potential bottom.
2. Bullish Engulfing – A small red candle followed by a large green candle that completely ‘engulfs’ the previous one. This indicates a sudden shift in momentum from sellers to buyers. The bigger the green candle, the stronger the signal.
3. Morning Star – A three-candle pattern: a long red candle, a small-bodied candle (any color), and a long green candle. It shows a transition from selling pressure to buying pressure, like the sun rising after a dark night.
Bearish Reversal Patterns (Signs of a Drop)
1. Shooting Star – The opposite of a hammer: a small body at the bottom of a long upper wick, appearing after an uptrend. It shows that buyers pushed prices up, but sellers slammed them back down. A potential top.
2. Bearish Engulfing – A small green candle followed by a large red candle that engulfs it. This shows a sudden takeover by sellers after a rally.
3. Evening Star – The mirror of the Morning Star: a long green candle, a small-bodied candle, and a long red candle. It signals the end of an uptrend.
Continuation Patterns (Signs of a Pause Before More Movement)
1. Doji – A candle with a very small body, meaning open and close are nearly equal. It signals indecision. When it appears after a strong trend, it often means a pause or a potential reversal, depending on the next candle.
2. Three White Soldiers – Three long green candles in a row, each closing higher than the last. This shows sustained buying pressure and often signals a strong uptrend continuation.
3. Three Black Crows – The bearish version: three long red candles in a row, each closing lower. This signals a strong downtrend continuation.
Risk Management
Patterns are powerful, but they are not crystal balls. Even the most reliable setups can fail. That’s why risk management is your true superpower.
- Always use a stop-loss. Place it just below (for bullish setups) or above (for bearish setups) the pattern’s extreme. This limits your loss if the market goes against you.
- Position size matters. Never risk more than 1-2% of your trading account on a single trade. This ensures one bad trade doesn’t wipe you out.
- Wait for confirmation. A pattern alone isn’t enough. Wait for the next candle to close in the direction of the signal. For example, after a hammer, wait for a green candle to confirm the bounce.
- Combine with other tools. Use trendlines, moving averages, or support/resistance to increase the odds. A hammer at a major support level is much stronger than one in the middle of nowhere.
Conclusion
Japanese candlestick patterns are like a window into the market’s psychology. They help you see where other traders are likely to act, giving you an edge in your decision-making. Start by mastering a few key patterns—like the hammer, engulfing, and doji—and practice spotting them on historical charts. Remember, no pattern works 100% of the time, so always trade with a plan and protect your capital. The market is a conversation, and candlesticks are the language. Start learning to listen today.