
Reading the Market’s Mind: Mastering Japanese Candlestick Patterns
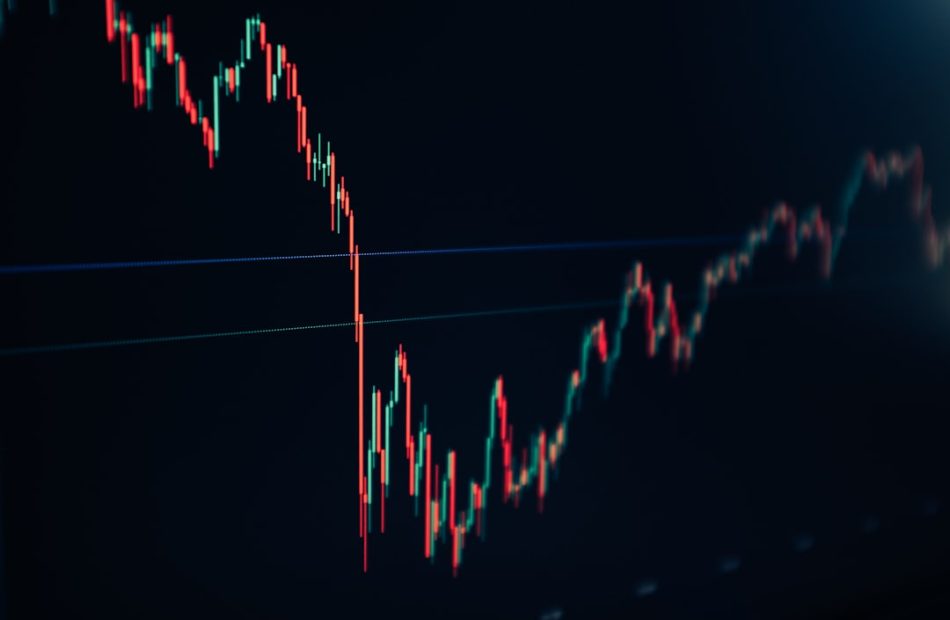
Imagine being able to glance at a chart and instantly know whether buyers or sellers are in control. That’s the power of Japanese candlestick patterns. These ancient tools, developed by rice traders in 18th-century Japan, are still the most effective way to read market sentiment and anticipate price movements. In this guide, you’ll learn the most reliable candlestick patterns and how to use them to improve your trading decisions—without getting lost in the noise.
How It Works
Candlesticks are more than just pretty bars on a chart. Each candle tells a story of the battle between bulls (buyers) and bears (sellers) during a specific time period. The body shows the opening and closing prices, while the wicks (or shadows) reveal the high and low. By recognizing specific formations, you can gauge who’s winning the battle and when a reversal or continuation is likely.
The key is context. A single candlestick pattern on its own is meaningless. But when it appears at a support level, resistance level, or after a strong trend, it becomes a powerful signal. Think of candlestick patterns as clues, not commands—always confirm with other indicators or price action.
The Setup
Here are the essential candlestick patterns every trader should know:
1. The Doji
The Doji occurs when the open and close are virtually the same, creating a small or non-existent body. It signals indecision in the market. After a strong uptrend, a Doji suggests buyers are losing steam; after a downtrend, it hints that sellers are exhausted. But a Doji alone isn’t enough—wait for the next candle to confirm the direction.
2. The Hammer and the Hanging Man
Both have the same shape: a small body at the top and a long lower wick (at least twice the body’s length). The difference is context. A Hammer appears after a downtrend and signals a bullish reversal—buyers stepped in to push prices back up. A Hanging Man appears after an uptrend and warns of a potential bearish reversal, as sellers started to overpower buyers.
3. The Engulfing Pattern
This two-candle pattern is a favorite among traders. A Bullish Engulfing occurs when a small bearish candle is followed by a larger bullish candle that completely ‘engulfs’ the previous one. It shows a dramatic shift from selling to buying. A Bearish Engulfing is the opposite: a small bullish candle followed by a large bearish candle, signaling that sellers have taken control.
4. The Morning Star and the Evening Star
These three-candle patterns are powerful reversal signals. A Morning Star appears after a downtrend: a long bearish candle, a small-bodied candle (the star), and then a long bullish candle that closes well into the first candle’s body. It represents a transition from fear to hope. An Evening Star is its mirror image, appearing after an uptrend and signaling a bearish reversal.
5. The Shooting Star
This single-candle pattern has a small body at the bottom and a long upper wick. It appears after an uptrend and indicates that sellers rejected higher prices, pushing the market back down. It’s the bearish counterpart to the Hammer.
How to Trade Them
1. Identify the trend: Use a moving average or trendline to determine the prevailing direction.
2. Wait for a pattern: Look for a candlestick pattern at a key level (support, resistance, or Fibonacci retracement).
3. Confirm with a follow-through: Don’t trade the pattern immediately. Wait for the next candle to close in the direction of the expected reversal.
4. Set your entry and stop: Enter on the confirmation candle’s close. Place your stop loss just beyond the pattern’s extreme (e.g., below the Hammer’s low or above the Shooting Star’s high).
5. Take profit: Aim for a risk-reward ratio of at least 1:2, using the next support/resistance level as your target.
Risk Management
No pattern is 100% reliable. Even the most beautiful bullish engulfing can fail. That’s why risk management is your true edge. Always risk only 1-2% of your trading capital on any single trade. Use stop losses to protect yourself from unexpected moves. And remember: candlestick patterns work best on higher timeframes (like the 1-hour, 4-hour, or daily charts) because they filter out market noise.
Additionally, avoid trading patterns that appear in the middle of a range or with low volume. The best signals occur when volume confirms the pattern—high volume on a bullish engulfing, for instance, shows strong conviction.
Conclusion
Japanese candlestick patterns are your window into the market’s psychology. They help you see the shift in power between buyers and sellers before the move happens. Start by mastering a few key patterns—the Doji, Hammer, Engulfing, and Morning/Evening Star—and practice them on a demo account. Over time, you’ll develop an intuition for reading price action that will elevate your trading to a new level. Remember, candlestick patterns are not magic; they’re tools. Combine them with solid risk management and a clear trading plan, and you’ll be well on your way to consistent profits.
Happy trading!