
Ride the Trend: How the 200-Day Moving Average Keeps You on the Right Side of the Market
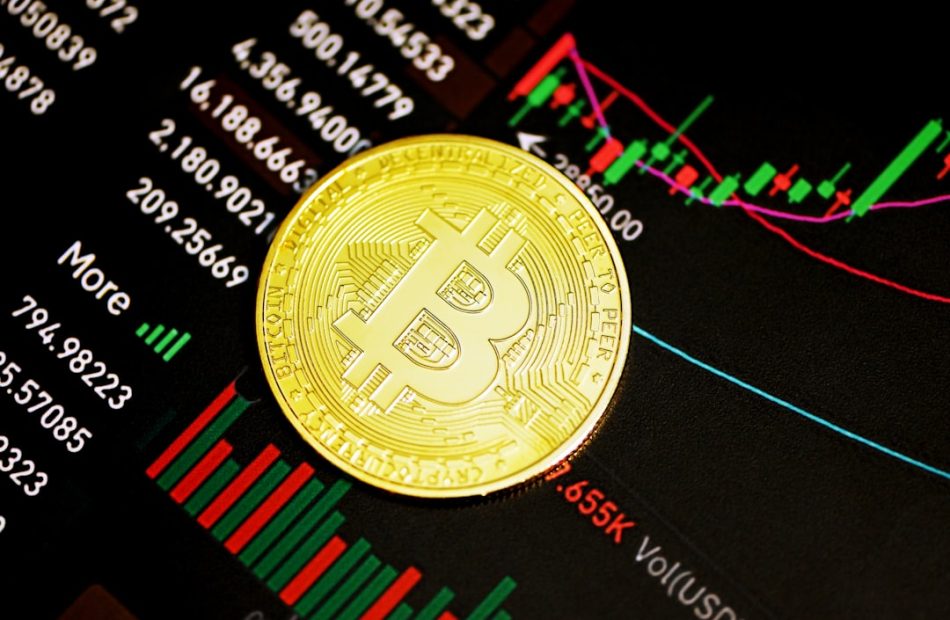
Imagine driving a car with no windshield wipers in a rainstorm. You’d be guessing where the road turns, right? That’s what trading without a trend filter feels like. The 200-Day Moving Average (200-MA) is your windshield wiper—it clears the noise and shows you the big-picture direction of the market.
Whether you’re trading Bitcoin, Ethereum, or altcoins, this simple tool can save you from buying into bear markets and missing bull runs. Let’s break it down.
How It Works
The 200-MA is the average price of an asset over the last 200 days. It smooths out daily ups and downs to reveal the underlying trend.
- Price above the 200-MA = Uptrend. The market is bullish. Focus on buying or holding.
- Price below the 200-MA = Downtrend. The market is bearish. Focus on selling, shorting, or staying in cash.
Think of it as a traffic light: green above, red below.
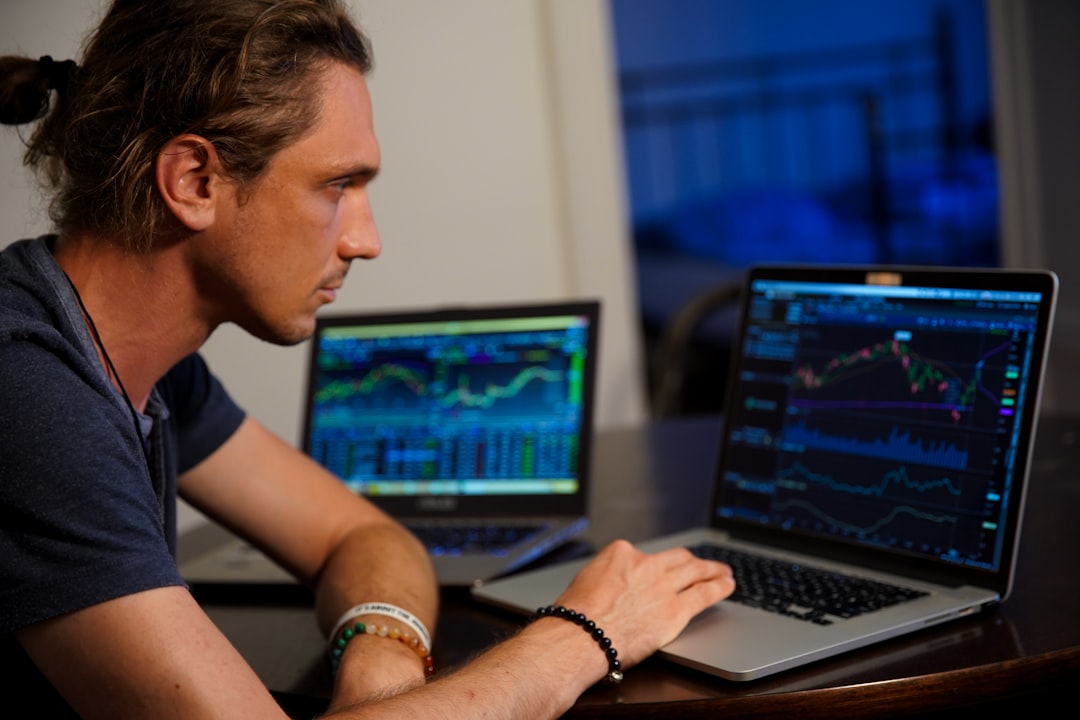
The Setup
1. Pick your chart – Use a daily timeframe (1D candle).
2. Add the indicator – Most platforms (TradingView, Binance, etc.) have a built-in 200-period Simple Moving Average (SMA). Apply it to the close price.
3. Define the rule – Only take long trades when price is above the 200-MA. Only take short trades when price is below it.
4. Wait for a close – A candle must close above or below the line to confirm the trend shift. Don’t act on intraday wicks.
Example: If Bitcoin is trading at $30,000 and the 200-MA is at $28,000, you’re in a bull trend. Look for buy setups like pullbacks to support. If it drops below $28,000 and closes, switch to bearish mode—consider selling or waiting.
Risk Management
The 200-MA isn’t a crystal ball. It lags because it’s based on past data. That means you’ll enter trends late and exit late. To survive:
- Use a stop loss – Place it below recent swing lows (in an uptrend) or above swing highs (in a downtrend).
- Position size – Risk only 1-2% of your account per trade. The 200-MA filter reduces your trade frequency, so each trade needs proper sizing.
- Combine with volume – If price crosses the 200-MA with high volume, the trend change is stronger. Low volume? Be cautious.
- Avoid choppy markets – When price oscillates around the 200-MA (whipsaws), step aside. Wait for a clear break and retest.
Conclusion
The 200-Day Moving Average is the ultimate trend filter for crypto traders. It doesn’t predict the future—it tells you where the market has been and helps you align with the dominant force. Use it to avoid buying into bear traps and to hold through bull runs with confidence.
Start by adding it to your chart today. Watch how price interacts with it over a week. You’ll quickly see why seasoned traders call it the “line in the sand.” Stay disciplined, manage your risk, and let the trend be your friend.