
The Golden Cross: Your Simple Guide to Riding Market Momentum

Imagine a signal that has historically marked some of the biggest bull runs in crypto and stock markets. It’s not a complex algorithm or a secret indicator—it’s the Golden Cross. This classic technical analysis pattern has been guiding traders for decades, and in this post, we’ll break it down so you can spot it with confidence and use it to enhance your trading strategy.
How It Works
The Golden Cross occurs when a short-term moving average crosses above a long-term moving average. In simple terms, it signals that recent price action is gaining strength and momentum is shifting upward. The most common setup uses the 50-day and 200-day moving averages, but you can adjust these to suit your trading style and timeframe.
Think of moving averages as smoothed-out lines that represent the average price over a set period. The 50-day MA reacts faster to price changes, while the 200-day MA is slower and reflects the longer-term trend. When the fast line jumps above the slow line, it’s a bullish sign—buyers are taking control.
Looking for altcoin opportunities and smooth trading? Try KuCoin.
The Setup
To spot a Golden Cross, you need a chart with the 50-day and 200-day moving averages plotted. Here’s the step-by-step:
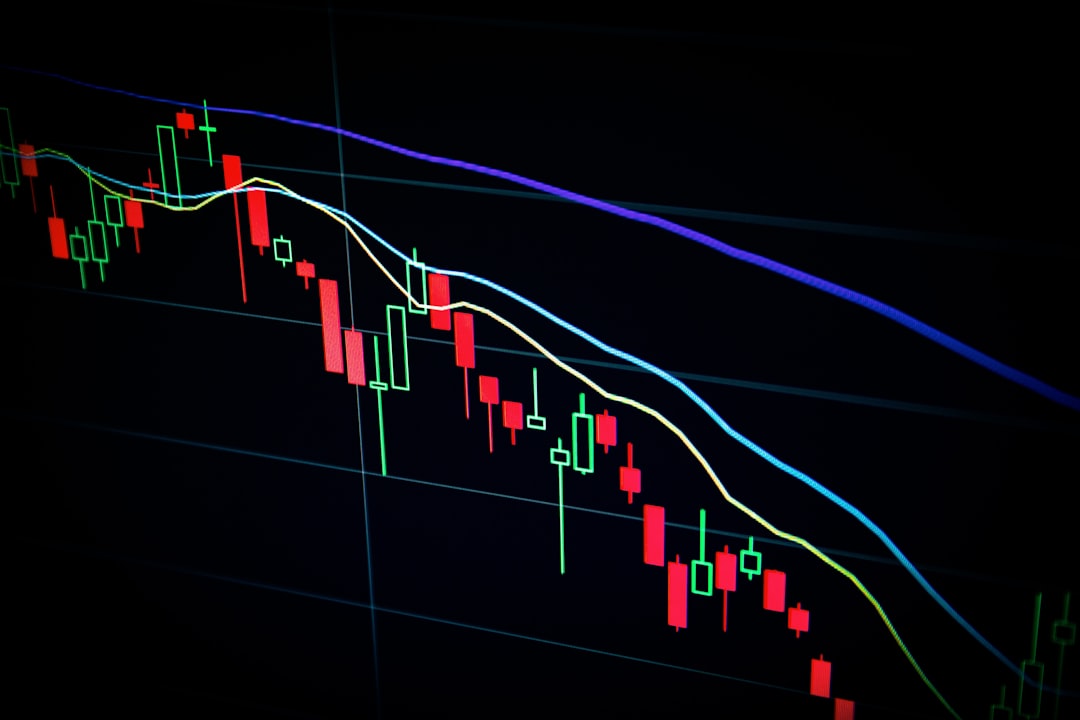
1. Wait for the crossover: The 50-day MA must cross from below to above the 200-day MA. This is your trigger.
2. Check the trend: Ideally, the price should be above the 200-day MA, confirming a broader uptrend.
3. Look for volume: A Golden Cross accompanied by increasing trading volume adds credibility. It shows that the move is backed by real buying interest.
4. Consider the context: The signal is stronger if it happens after a prolonged downtrend or a consolidation phase, as it marks a potential reversal.
Many traders also use a Golden Cross on shorter timeframes (like the 20/50 on a 4-hour chart) for swing trading. The principle is the same, but the signals are more frequent.
Risk Management
No signal is 100% accurate, and the Golden Cross is no exception. Here’s how to protect your capital:
- Set a stop-loss: Place a stop-loss below the recent swing low or below the 200-day MA. If the market reverses, you exit with a limited loss.
- Use position sizing: Never risk more than 1-2% of your trading account on a single trade. This ensures you can survive a series of losses.
- Beware of false signals: In choppy or sideways markets, moving averages can cross back and forth, creating whipsaws. Wait for a clear breakout or additional confirmation (like a bullish candlestick pattern) before entering.
- Take profits: Have a target in mind, whether it’s a previous resistance level or a percentage gain. Trail your stop to lock in profits as the trend develops.
Conclusion
The Golden Cross is a powerful, yet simple tool that can help you identify major trend reversals and ride momentum. It’s not a magic bullet, but when combined with sound risk management and a clear trading plan, it can be a valuable addition to your arsenal. Start by practicing on historical charts, then apply it to live markets with small positions. Remember, the goal is consistent growth, not hitting home runs. Happy trading, and may the crosses be ever in your favor!