
Mastering the Stochastic Dip: A Simple Strategy for Buying Pullbacks
Every trader loves the idea of buying the dip. But how do you know when a dip is actually a buying opportunity and not the start of a deeper crash? The Stochastic Oscillator gives us a clear, data-driven answer. By combining a simple momentum indicator with basic price action, you can spot high-probability entry points during uptrends.
How It Works
The Stochastic Oscillator measures where the current closing price sits relative to its recent price range (typically the last 14 periods). It outputs two lines: %K (the fast line) and %D (the slow moving average of %K).
- Overbought (above 80): Momentum is strong, but a reversal or pullback could happen.
- Oversold (below 20): Selling pressure is extreme, and a bounce may be near.
For dip buying, we focus on oversold conditions within an uptrend. The key is context: the overall trend must be bullish. If the market is in a downtrend, an oversold Stochastic can keep getting more oversold – that’s a falling knife, not a dip.
The Setup
Here’s a step-by-step framework for the Stochastic Dip Buy:
1. Identify the Uptrend – Look for higher highs and higher lows on a higher timeframe (daily or 4-hour). Use a simple moving average (e.g., 50 EMA) as a dynamic support.
2. Wait for a Pullback – Price retraces toward the moving average or a key support level.
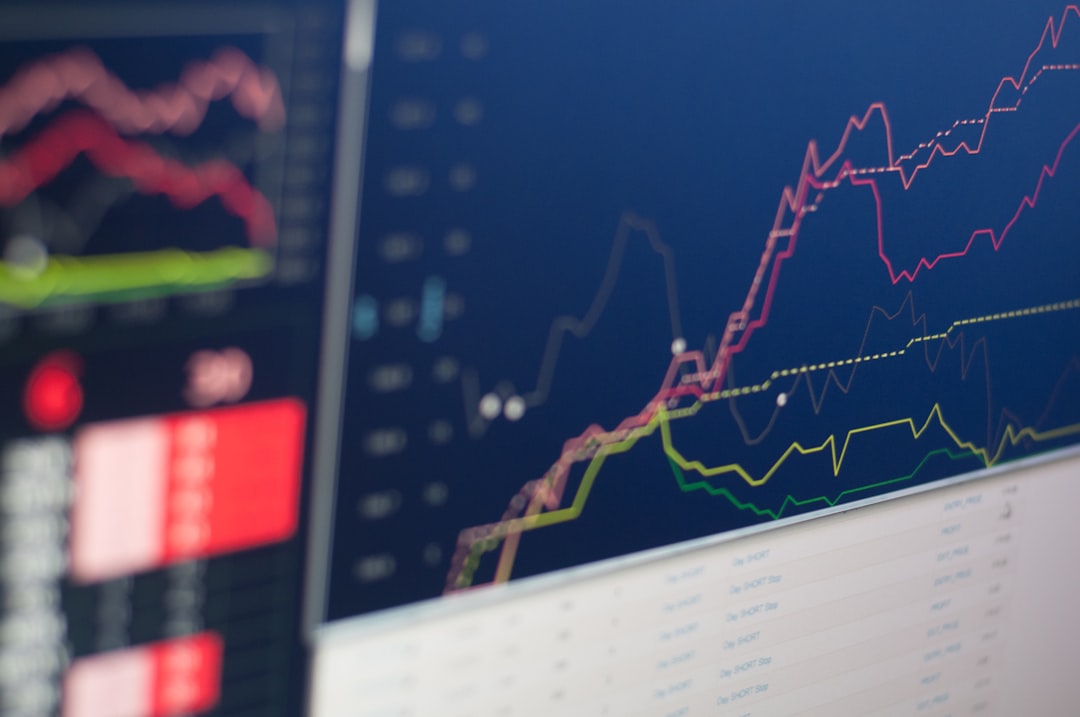
3. Stochastic Goes Oversold – The %K line drops below 20. Ideally, it also crosses back above 20 (the “cross” confirmation).
4. Entry Signal – Enter a long position when the Stochastic %K crosses above %D while both are below 20, or when price shows a bullish reversal candlestick (e.g., hammer or engulfing).
5. Stop Loss – Place it below the recent swing low or below the moving average, whichever is tighter.
6. Take Profit – Target the previous high or a 1:2 risk-to-reward ratio.
Example in Action
Imagine Bitcoin is in a steady uptrend on the 4-hour chart, holding above the 50 EMA. Price pulls back, the Stochastic dips to 15, and then %K crosses above %D. You enter long at $30,000. Stop at $29,500 (below the swing low). Target $31,000. The trade works because the trend was your friend.
Risk Management
No strategy works 100% of the time. Protect your capital:
- Never risk more than 1-2% of your account on a single trade.
- Avoid using this strategy in choppy or sideways markets – the Stochastic will whip you in and out.
- Use a higher timeframe filter – if the weekly chart is bearish, don’t buy the dip on the hourly.
- Combine with volume – increasing volume on the bounce confirms buying interest.
Conclusion
The Stochastic Oscillator dip-buy strategy is a powerful tool when used with respect for the trend. It turns guesswork into a structured plan. Remember: the best dips happen in uptrends. Master this concept, and you’ll stop chasing breakouts and start buying fear with confidence.
Art & Collectibles: Fractional Ownership Guide
Art and collectibles have long been the domain of the ultra-wealthy, with masterpieces by Picasso or rare vintage cars trading for millions. Today, tokenization is democratizing access to these tangible assets, allowing investors to buy fractions of a painting, a classic Ferrari, or a rare baseball card. This guide explains how fractional ownership of art and collectibles works, the risks and rewards, and how you can get started.
What Is Fractional Ownership of Art and Collectibles?
Fractional ownership splits a high-value asset into smaller, tradable shares. Each share represents a proportional claim on the underlying asset. In the traditional world, this was possible only through private syndicates or investment funds. On-chain tokenization makes it transparent, liquid, and accessible to retail investors.
Off-chain vs On-chain
In the off-chain model, ownership is recorded in a legal contract or a special purpose vehicle (SPV). The asset stays in a vault, and investors hold shares in the SPV. On-chain tokenization takes this a step further: the shares are minted as digital tokens (often ERC-20 or similar) on a blockchain. The tokens can be traded peer-to-peer, 24/7, on decentralized exchanges. The legal claim remains off-chain, but the token represents that claim.
How It Works: The Technical Process
The process of tokenizing a physical artwork or collectible involves several layers:
- Asset Selection & Valuation: An artwork is appraised by certified experts. The value determines how many tokens will be issued.
- Legal Structuring (SPV): A Special Purpose Vehicle (SPV) is created to hold legal title to the asset. Investors buy tokens that represent shares in the SPV.
- Tokenization: The SPV issues tokens on a blockchain (e.g., Ethereum, Polygon). Each token is a digital representation of ownership.
- Oracles & Custody: Price oracles (like Chainlink) provide real-time valuation data. The physical asset is stored in a regulated vault or museum-grade facility.
- Secondary Trading: Tokens are listed on exchanges or peer-to-peer marketplaces. Investors can buy or sell fractions at any time.
Investment Analysis: Pros, Cons, and Risks
Fractional ownership offers unique advantages but also carries specific risks.
Pros
- Low Entry Barrier: Invest in a $10 million painting for as little as $50.
- Liquidity: Trade your fraction on secondary markets instead of waiting months for a private sale.
- Diversification: Build a portfolio of multiple assets (art, wine, classic cars) without tying up huge capital.
- Transparency: Blockchain records every transaction, and custody is often audited.
Cons
- Illiquidity Risk: Despite tokenization, some fractions may have thin trading volumes.
- Valuation Uncertainty: Art prices are subjective and can be volatile.
- Regulatory Gray Area: Securities laws may apply. Always check if the token is classified as a security.
- Smart Contract Risk: Bugs or exploits in the token contract can lead to loss of funds.
For a broader market view, check out our analysis on What Caused the Crypto Crash of 2026? Bitcoin & Ether’s Worst Week Explained. Investors often compare this to How to Participate in Governance Proposals (DAOs): A Complete Guide for 2025.
Tool Recommendation
If you are ready to explore fractional ownership of real-world assets, you need a reliable platform to start. Binance offers a secure environment to buy, sell, and trade tokenized assets. You can practice this setup safely on Binance. Create your account here.
FAQ Section
What happens if the physical artwork is damaged or stolen?
Most tokenized art platforms require the custodian to carry full insurance. In case of loss, the insurance payout is distributed to token holders proportionally. Always verify the insurance policy before investing.
Can I sell my fraction at any time?
Yes, if the tokens are listed on a secondary market. However, liquidity depends on demand. Some platforms offer buyback guarantees or automated market makers to ensure you can exit.
Are these tokens considered securities?
In many jurisdictions, tokens that represent fractional ownership of an asset and pay dividends or profits are classified as securities. Platforms must comply with local regulations (e.g., SEC in the US). Always read the offering documents.
Conclusion
Fractional ownership of art and collectibles is a compelling bridge between the tangible world of fine art and the efficiency of blockchain. It lowers barriers, increases liquidity, and brings transparency to a historically opaque market. However, investors must navigate valuation risks, regulatory uncertainty, and smart contract vulnerabilities. As the RWA ecosystem matures, platforms like Binance are making it easier to participate. Start small, diversify, and always do your due diligence.
Using Etherscan: Tracking Whales and Verifying Transactions – The Ultimate Guide
Etherscan is the leading blockchain explorer for Ethereum, offering unparalleled transparency into on-chain activity. Whether you’re a DeFi enthusiast, a trader, or a developer, mastering Etherscan allows you to track whale movements, verify transactions, and gain critical insights into market sentiment. This guide covers everything you need to know to use Etherscan like a pro.
Key Concepts
What is Etherscan?
Etherscan is a block explorer and analytics platform for the Ethereum blockchain. It indexes every transaction, smart contract, and wallet address, making all data publicly searchable. You can use it to check transaction status, view token balances, and monitor large holders (whales).
How to Track Whales on Etherscan
Whales are addresses holding significant amounts of ETH or tokens. To track them:
- Use the Token Holders tab: For any ERC-20 token, click on the token contract address, then go to the ‘Holders’ tab. Sort by balance to see the top holders.
- Monitor whale transactions: Use the ‘Transactions’ tab on a whale address to see incoming/outgoing transfers. Look for large amounts (e.g., >100 ETH) to spot accumulation or distribution.
- Set alerts: Use third-party tools like Etherscan’s own ‘Watch List’ (free account required) to get email notifications when a tracked address makes a transaction.
How to Verify a Transaction
Every transaction on Ethereum has a unique hash. To verify:
- Copy the transaction hash (TxHash) from your wallet or exchange.
- Paste it into the Etherscan search bar.
- Check the status: ‘Success’ means confirmed, ‘Pending’ means waiting for blocks, ‘Fail’ means reverted (gas wasted).
- Review details: From/To addresses, value transferred, gas used, and block number.
Pro Tips
- Use the ‘Advanced’ filter: On the main transactions page, click ‘Advanced’ to filter by block range, value, or token type. This helps isolate whale activity.
- Check internal transactions: Some DeFi interactions (e.g., swaps) involve internal calls. Use the ‘Internal Txns’ tab to see the full flow of funds.
- Verify contract source code: For any smart contract, click the ‘Contract’ tab and look for a green checkmark (verified source). This confirms the code matches the deployed bytecode.
- Use the ‘Read Contract’ feature: Interact with contract functions directly from Etherscan – useful for checking balances or staking parameters without writing code.
FAQ Section
Is Etherscan free to use?
Yes, Etherscan is free for basic searches and browsing. Advanced features like API access or custom alerts may require a paid plan or a free account.
Can I track a specific whale address?
Yes. Simply enter the wallet address in the search bar. You can then bookmark the page or add it to your Etherscan Watch List for notifications.
How do I know if a transaction is confirmed?
Look for the ‘Status’ field. ‘Success’ means the transaction is confirmed and included in a block. ‘Pending’ means it’s still in the mempool.
What does ‘Out of Gas’ mean?
It means the transaction ran out of gas before completing. The transaction fails, but you still pay the gas fee. Always set a higher gas limit for complex contract interactions.
Conclusion
Etherscan is an indispensable tool for anyone active in the Ethereum ecosystem. By learning to track whales and verify transactions, you gain a significant edge in understanding market dynamics and ensuring your own funds are secure. Start exploring Etherscan today – the blockchain’s transparency is your greatest asset.
For more details on this, check out our guide on Identity on Chain: KYC and Compliance in DeFi.
You might also be interested in reading about Bitcoin Mining Difficulty Sees Last Adjustment Increase in 2025.
LINE NEXT Opens Unifi Pay for Zero-Fee Stablecoin Payments
July 3, 2025 — LINE NEXT, the U.S.-based blockchain affiliate of LINE Yahoo, has opened developer pre-registration for Unifi Pay, a zero-fee stablecoin payment infrastructure slated for global launch in the third quarter. The service will initially support USDT, JPYC, and IDRP through the Unifi stablecoin wallet.
Immediate Details & Direct Quotes
Want to trade this news? Bitget offers professional charting tools and deep liquidity.
Unifi Pay processes payments and settlements directly through a wallet-based structure, eliminating all transaction fees for users. According to a CoinPost report, the beta version handled 100 billion Korean won (approximately 10 billion Japanese yen) in cumulative payment and settlement volume over the past year.
The service offers an average settlement speed of about one second. Developers can integrate payments using the Unifi Pay SDK, which utilizes an Agent-to-Agent (A2A) task execution method for AI agents. LINE NEXT says the SDK allows a payment page to be created in approximately 10 minutes through a single command input.
“Unifi Pay directly connects users and suppliers and removes payment fees from the transaction process,” the company stated in its announcement.
LINE NEXT CEO Youngsu Ko said the company plans “to establish Unifi Pay as a payment infrastructure that connects developers, creators, and users around the world through its developer tools.”
Developers who keep payment proceeds in the wallet may receive annual rewards of up to 5%, depending on the stablecoin type. The reward model is tied to stablecoin holdings inside the wallet.
Market Context & Reaction
Unifi Pay will launch globally supporting three stablecoins: Tether’s USDT, the Japanese yen-denominated JPYC, and the Indonesian rupiah-denominated IDRP. In Japan and Indonesia, users can complete online identity verification and top up JPYC or IDRP directly from bank accounts. LINE NEXT confirmed plans to add local stablecoins in additional countries based on each market’s regulatory environment.
The service provides a function enabling settlement funds to be sent directly to bank accounts through connected crypto exchanges and blockchain remittance solutions. This gives suppliers and developers a path to convert stablecoin payments into bank account funds after receiving them through the wallet.
LINE NEXT has access to LINE Yahoo’s 300 million user base, providing a substantial built-in market for the payment infrastructure.
Background & Historical Context
Unifi Pay’s development follows Project Unify, announced during Korea Blockchain Week in September 2025. Project Unify was described as a stablecoin super-app designed to bring payments, yield, on/off-ramps, and access to over 100 decentralized apps into LINE Messenger, which Kaia reported had nearly 200 million monthly active users across Japan, Taiwan, Thailand, and Indonesia.
Project Unify was set to support USD, JPY, KRW, THB, IDR, PHP, MYR, and SGD at launch, offering developers and issuers a Unify SDK with regulatory compliance focus, particularly for South Korea. The initiative followed the 2024 merger of LINE’s Finschia and Kakao’s Klaytn into Kaia, which positions itself as Asia’s stablecoin orchestration layer.
LINE NEXT has now started accepting developer pre-registrations ahead of Unifi Pay’s official global rollout.
What This Means
In the short term, developers and businesses in Japan and Indonesia gain immediate access to zero-fee stablecoin payments with direct bank account integration. The one-second settlement speed could make Unifi Pay competitive with traditional payment rails for low-cost, high-speed transactions.
The 5% annual reward for holding stablecoins in the wallet creates an incentive for developers to maintain balances within the Unifi ecosystem rather than immediately cashing out.
Long-term, LINE NEXT’s expansion into additional local stablecoins across different markets could position Unifi Pay as a multi-currency payment infrastructure spanning Asia and beyond. The platform’s access to LINE Yahoo’s 300 million users provides significant adoption potential.
The planned global launch in the third quarter represents the next phase following a successful beta that demonstrated volume and real-world usage across 100 billion won in transactions.
Master the RSI Divergence Strategy: Spot Reversals Before They Happen
Imagine being able to spot a market reversal before the crowd—while everyone else is still buying the top or selling the bottom. That’s the power of the RSI Divergence Strategy. It’s one of the most reliable tools in a trader’s toolbox, and once you understand it, you’ll never look at a chart the same way again.
How It Works
The Relative Strength Index (RSI) is a momentum oscillator that measures the speed and change of price movements. Typically, it ranges from 0 to 100, with levels above 70 considered overbought and below 30 considered oversold. But here’s the magic: when the price makes a higher high or lower low, but the RSI doesn’t confirm it, we get a divergence. This signals that momentum is weakening, and a reversal may be coming.
There are two types of divergence:
- Bullish Divergence: Price makes a lower low, but RSI makes a higher low. This suggests selling pressure is fading, and a move up is likely.
- Bearish Divergence: Price makes a higher high, but RSI makes a lower high. This suggests buying pressure is dying, and a move down is coming.
The Setup
Here’s a step-by-step setup for trading RSI divergence:
1. Identify a clear trend – Look for a strong uptrend or downtrend on a higher timeframe (like 1-hour or 4-hour).
2. Watch for overbought/oversold – Wait for RSI to enter extreme zones (above 70 for bearish, below 30 for bullish).
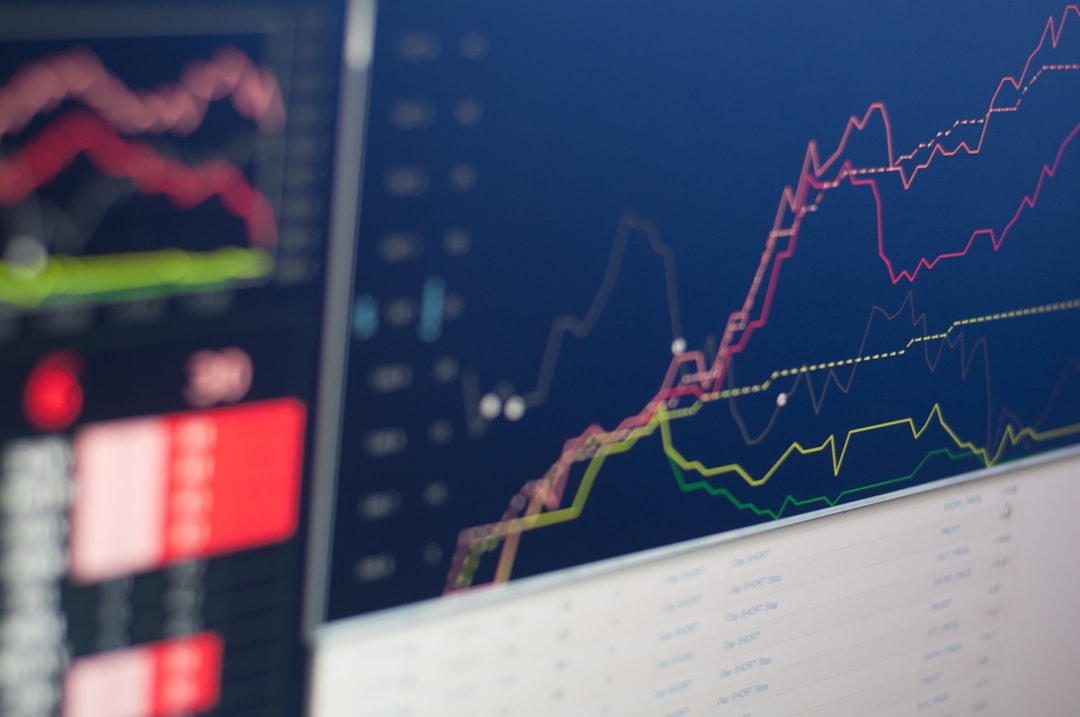
3. Spot the divergence – Draw lines connecting the price peaks/troughs and the RSI peaks/troughs. If they move in opposite directions, you have a divergence.
4. Wait for confirmation – Don’t jump in immediately. Wait for the price to break a key level (like a trendline or support/resistance) or for the RSI to cross back into the neutral zone (30-70).
5. Enter the trade – For bullish divergence, buy after confirmation. For bearish divergence, sell or short.
Pro Tip: Use hidden divergences (where price and RSI move in the same direction but with different slopes) to confirm trend continuations, not just reversals.
Risk Management
No strategy is perfect, and divergences can fail—especially in strong trends. Here’s how to protect yourself:
- Set a stop loss – Place it just below the recent swing low (for bullish) or above the recent swing high (for bearish).
- Use a risk-reward ratio of at least 1:2 – Aim for targets based on previous support/resistance levels or Fibonacci extensions.
- Don’t chase – If the price has already moved significantly after the divergence, wait for the next setup.
- Combine with other indicators – Add volume or moving averages to filter out false signals. For example, bullish divergence with increasing volume is much stronger.
Remember: Divergence tells you momentum is slowing, not that the trend will reverse instantly. Patience is key.
Conclusion
The RSI Divergence Strategy is a game-changer for traders who want to anticipate market turns. By watching for hidden clues in momentum, you can enter trades with a high probability of success. Start practicing on a demo account or paper trade first. Over time, you’ll develop an eye for spotting these patterns quickly. Happy trading!
How to Bridge Assets Across Blockchains Safely: A Complete Guide for 2025
Introduction
As the crypto ecosystem expands into a multi-chain world, moving assets from one blockchain to another—known as bridging—has become an essential skill for traders, DeFi users, and investors. However, bridges are also prime targets for hacks and user errors. This guide will walk you through the safest methods to bridge your tokens, covering key concepts, pro tips, and the best tools to minimize risk and fees.
Key Concepts
What is a Blockchain Bridge? A blockchain bridge is a protocol that allows you to transfer tokens or data between two different blockchains (e.g., from Ethereum to BNB Chain). Bridges typically lock assets on the source chain and mint equivalent tokens on the destination chain.
Types of Bridges:
- Trusted Bridges: Rely on a central entity or federation to validate transactions. Faster but require trust.
- Trustless Bridges: Use smart contracts and cryptographic proofs. More secure but can be slower and more expensive.
- Liquidity Networks: Use atomic swaps between liquidity pools on each chain.
Common Risks:
- Smart contract vulnerabilities (hacks)
- Impermanent loss in liquidity pools
- Front-running and MEV attacks
- User error (wrong address, wrong chain)
Pro Tips
- Always verify the bridge address from the official project website or reputable aggregators like DeFi Llama. Avoid clicking on sponsored ads.
- Start with a small test transaction before moving large amounts. This confirms the bridge is working and you’ve selected the correct destination network.
- Check the bridge’s liquidity and TVL—higher liquidity usually means lower slippage and less risk of a liquidity crisis.
- Use bridges with a proven track record and audited smart contracts. Avoid brand-new or unaudited bridges.
- Monitor gas fees on both chains. Sometimes it’s cheaper to use a centralized exchange as an intermediary than a direct bridge.
FAQ Section
What is the safest bridge for beginners?
For beginners, using a centralized exchange like MEXC as an intermediary is often the safest approach. You deposit assets on one chain, sell them, withdraw to the other chain. This avoids smart contract risk entirely.
How long does a bridge transaction take?
It varies from a few seconds (for fast finality chains) to 30 minutes or more (for Ethereum mainnet). Always check the bridge’s estimated time.
Can I lose my funds if a bridge gets hacked?
Yes, if the bridge’s smart contract is exploited, your locked funds could be stolen. This is why we recommend using audited, battle-tested bridges or centralized exchanges for large amounts.
What are the fees for bridging?
Fees include network gas fees on both chains plus a bridge fee (usually 0.1%–1% of the transaction amount). Some bridges also charge a fixed fee.
Conclusion
Bridging assets across blockchains opens up a world of opportunities in DeFi, NFTs, and multi-chain trading. By understanding the key concepts, following pro tips, and choosing the right tools—like MEXC for low-fee, secure transfers—you can navigate the multi-chain landscape with confidence. For more details on this, check out our guide on Australia’s Crypto License Extension: What It Means for Your Investments. You might also be interested in reading about How SPVs Protect RWA Investors: A Complete Guide.
Top RWA Projects to Watch in 2026: Tokenized Real-World Assets Guide
Real World Assets (RWAs) represent one of the most transformative trends in decentralized finance. By tokenizing tangible and intangible assets—such as real estate, government bonds, commodities, and private credit—on a blockchain, RWAs bridge the gap between Traditional Finance (TradFi) and DeFi. This guide explores the top RWA projects to watch in 2026, offering a professional, data-driven analysis for investors seeking exposure to this rapidly growing asset class.
What Are Real World Assets (RWAs)?
RWAs are physical or financial assets that exist off-chain but are represented on-chain via tokens. The key difference between off-chain and on-chain assets lies in liquidity, accessibility, and transparency. Off-chain assets (e.g., a commercial building) are illiquid, require intermediaries, and have limited trading hours. On-chain tokens representing that building enable fractional ownership, 24/7 trading, and real-time verification via blockchain oracles. Reports from BlackRock and data from RWA.xyz show that the total value locked in RWA protocols exceeded $15 billion in 2025, with projections for 2026 reaching $50 billion.
How RWA Tokenization Works
The technical process involves several key steps:
- Asset Identification: A real-world asset (e.g., a U.S. Treasury bond or a commercial real estate property) is selected for tokenization.
- Special Purpose Vehicle (SPV): A legal entity is created to hold the asset, ensuring legal ownership and compliance with securities laws.
- Oracle Integration: Chainlink or other decentralized oracles feed real-time price and status data from the off-chain world to the blockchain.
- Token Minting: The asset is divided into fungible or non-fungible tokens (e.g., ERC-20 or ERC-721) that represent fractional ownership.
- On-Chain Distribution: Tokens are listed on decentralized exchanges or platforms, enabling global, permissionless trading.
Top RWA Projects to Watch in 2026
1. Ondo Finance
Ondo Finance tokenizes U.S. Treasuries and money market funds, offering institutional-grade yields (currently ~5.2% APY) to DeFi users. Its flagship product, OUSG, is backed by BlackRock’s iShares Short Treasury Bond ETF. Ondo has secured partnerships with major custodians and is expanding into private credit.
2. Centrifuge
Centrifuge focuses on tokenizing real-world credit, including invoices, consumer loans, and mortgages. Its Tinlake protocol allows investors to earn yield by funding asset-backed pools. In 2025, Centrifuge facilitated over $500 million in loans, with default rates below 1% due to rigorous underwriting.
3. MakerDAO (Spark Protocol)
MakerDAO, the issuer of DAI, has integrated RWAs as collateral through its Spark Protocol. Over 20% of DAI’s collateral now consists of tokenized real estate and bonds, generating stable yields for the protocol. MakerDAO’s RWA exposure is expected to double in 2026 as it expands into European green bonds.
4. Polymesh
Polymesh is a purpose-built blockchain for regulated assets, including tokenized equities and bonds. It offers built-in identity verification (KYC) and compliance modules, making it a favorite among institutional issuers. Polymesh has listed over $2 billion in tokenized securities from firms like INX and tZERO.
Investment Analysis: Pros, Cons, and Risks
Pros:
- Fractional Ownership: Investors can buy a piece of a $10 million building for as little as $100.
- 24/7 Liquidity: Tokenized assets can be traded on decentralized exchanges at any time, unlike traditional markets.
- Transparency: On-chain records provide immutable proof of ownership and transaction history.
Cons & Risks:
- Regulatory Uncertainty: Securities laws vary by jurisdiction. The SEC has classified many RWA tokens as securities, requiring compliance.
- Smart Contract Risk: Bugs in tokenization or oracle contracts can lead to loss of funds. Audits by firms like Trail of Bits are essential.
- Counterparty Risk: The SPV holding the off-chain asset may be subject to bankruptcy or fraud.
For a broader market view, check out our analysis on DePIN Explained: Earning Passive Income with Infrastructure. Investors often compare this to Identity on Chain: KYC and Compliance in DeFi.
Tool Recommendation
Looking for altcoin opportunities and smooth trading? Try KuCoin. KuCoin offers a wide range of RWA tokens, including ONDO, CFG, and POLYX, with low fees and high liquidity. Sign up here to start trading.
FAQ
What is the difference between RWA tokens and stablecoins?
Stablecoins like USDC are backed by cash or short-term Treasuries, aiming for a 1:1 peg. RWA tokens represent ownership in a broader set of assets (e.g., real estate, bonds) and can fluctuate in value based on the underlying asset’s performance.
Are RWA investments regulated?
Yes, most RWA tokens are classified as securities under U.S. law and must comply with SEC regulations. Projects like Polymesh and Ondo Finance work with legal counsel to ensure compliance, including KYC/AML checks for investors.
How do I earn yield from RWAs?
Yield is generated from the underlying asset’s cash flows—e.g., rental income from real estate, interest from bonds, or repayment of loans. Protocols distribute these yields to token holders, often via smart contracts, with APYs ranging from 4% to 15%.
Conclusion
RWA tokenization is reshaping finance by making illiquid assets accessible, liquid, and transparent. In 2026, projects like Ondo Finance, Centrifuge, MakerDAO, and Polymesh are poised for significant growth, driven by institutional adoption and regulatory clarity. However, investors must carefully assess risks—especially regulatory and smart contract vulnerabilities. For those ready to explore, KuCoin offers a reliable gateway to trade these tokens. As the sector matures, RWAs could become a cornerstone of diversified portfolios, blending the stability of TradFi with the innovation of DeFi.
Bitcoin’s Bearish Candle Explained: A Beginner’s Guide to Reading the Charts
Did you know that a single monthly candlestick can tell you more about market sentiment than a week of headlines? Bitcoin just gave us that warning signal. In June 2026, Bitcoin fell roughly 20% to below $60,000—its worst monthly performance since June 2022. But the raw percentage isn’t the whole story. The monthly price chart reveals something that has experienced traders paying close attention: a rare, nearly perfect “red brick” candle that signals complete bear dominance. If you’re learning to read crypto charts, understanding this pattern is essential for making informed decisions. This guide explains what a Marubozu candlestick is, why it matters for Bitcoin’s outlook, and how you can use candlestick patterns to understand market sentiment—without the hype or fear.
Read time: 8-10 minutes
Understanding Candlestick Charts for Beginners
A candlestick chart is a visual tool that summarizes an asset’s price action over a specific time period. Think of it like a weather report for a single day: it shows you the high, low, open, and close price. Just as a weather report tells you the temperature range and conditions, a candlestick tells you whether buyers (bulls) or sellers (bears) were in control.
Each candlestick has two main parts:
- The Body: The thick rectangle. A green or white body means the price closed higher than it opened (bullish). A red or black body means the price closed lower than it opened (bearish).
- The Wicks (or Shadows): The thin lines extending above and below the body. The top wick shows the highest price reached. The bottom wick shows the lowest price reached.
Why was this tool created? Traders needed a way to see the full picture of market activity at a glance. A single candlestick can tell you if buyers fought back, if sellers dominated the entire session, or if the market was indecisive.
A real-world crypto example: Imagine you’re looking at a daily candlestick for Bitcoin:
- Long upper wick, small red body: Sellers pushed the price down from its high, defending against a rally.
- Long lower wick, small green body: Buyers stepped in to defend the price from falling further, creating a “bounce.”
- No wicks, solid body (like the June candle): One side completely dominated. There was no fight. The market moved in a straight line from open to close.
The Technical Details: How the June Candle Signals Bearish Dominance
The June 2026 monthly candlestick for Bitcoin is a textbook example of what traders call a “Marubozu” candle—a Japanese term meaning “shaved head” or “bald.” This candle has virtually no wicks at either end. Here’s what that tells us:
1. Open at the High, Close at the Low: The price opened on June 1 at the month’s highest point and closed on June 30 at the month’s lowest point. There was no bounce, no relief rally, no attempt by buyers to push the price back up.
2. No Upper Wick: This means sellers immediately took control from the start. There was no attempt to push the price higher that was then rejected. The selling began immediately.
3. No Lower Wick: This means buyers never stepped in to defend the price. Even as Bitcoin fell 20%, there was no significant buying pressure to create a “floor.” The market accepted the lower price without resistance.
Why this structure matters: A normal monthly candle, even in a bad month, usually shows some two-sided activity. For example, a bearish month might have a long lower wick, indicating that buyers tried to support the price at certain levels. The complete absence of this in June suggests that sellers were in complete, uninterrupted control. It’s like a one-sided election where the loser didn’t even show up to campaign.
Visual cue: An infographic comparing a “normal” monthly candle (with visible wicks and price fluctuations) versus the June “Marubozu” candle (a solid red block) would help illustrate this concept instantly.
Current Market Context: Why This Matters Now
As of early July 2026, Bitcoin is trading near $58,600, a slight recovery from its June lows but still well below the $70,000+ levels seen earlier this year. The market context provides important background for this technical signal:
- Market Cap Impact: Bitcoin’s market capitalization fell below $1.2 trillion during June, erasing gains from the first half of the year.
- ETF Outflows: U.S. spot Bitcoin ETFs saw their worst month ever in June, shedding $4.5 billion. This institutional selling pressure directly contributed to the relentless selling seen on the monthly chart.
- Volume Analysis: Trading volume was elevated throughout June, confirming that the selloff was accompanied by genuine market participation—not just a low-liquidity anomaly.
The Marubozu candle reinforces what analysts are already saying: that Bitcoin may face further downside before finding a bottom. Several analysts predict a potential bottom in the $48,000 to $55,000 range, a level not seen since early 2024.
Competitive Landscape: How This Signal Compares to Past Bitcoin Crashes
The June 2026 Marubozu candle is notable when compared to other major Bitcoin corrections:
| Feature | June 2026 (This Event) | May 2022 (Terra Collapse) | November 2022 (FTX Collapse) |
|---|---|---|---|
| Monthly Drop | ~20% | ~17% | ~23% |
| Candlestick Pattern | Marubozu (no wicks) | Long lower wick (buyers defended) | Small body (indecision after initial crash) |
| Market Sentiment | Complete bear dominance, no buyer resistance | Panic selling followed by strong buying at lows | Extreme shock, but market stabilized by month’s end |
| Key Driver | ETF outflows, macro uncertainty | Stablecoin collapse | Exchange bankruptcy |
| Outcome After | TBD | Further losses before bottoming in June 2022 | Accumulated for 6 months before major rally |
Why this matters: The June 2026 candle shares characteristics with the May 2022 Terra collapse in terms of percentage drop, but its pattern is more decisive. The absence of buyer defense makes this a potentially more bearish signal than previous crashes. However, it’s important to remember that each market cycle is different, and past patterns don’t guarantee future results.
Practical Applications: Real-World Use Cases
How can you use candlestick patterns like the Marubozu in your own crypto journey?
- Recognizing Trend Strength: A Marubozu confirms that the current trend (downward, in this case) is strong. It tells you not to “buy the dip” prematurely because the selling pressure hasn’t shown signs of exhaustion.
- Waiting for Confirmation: After a Marubozu, smart traders wait for the next candle to confirm a reversal. For example, a green candle with a long lower wick in July would signal that buyers are finally stepping in.
- Setting Stop-Losses: If you’re holding Bitcoin, this pattern suggests you should be more conservative with your stop-loss orders. The absence of buyer defense means further losses are possible before a bottom forms.
- Understanding Market Psychology: The June candle tells us that even major buyers (like ETF investors) were selling. This helps you understand that the market is in a “risk-off” phase, not just random volatility.
Best for: Any crypto investor who wants to make decisions based on market data rather than emotions or hype.
Risk Analysis: Expert Perspective
Primary Risks:
1. False Signal Risk: While the Marubozu is a powerful signal, no single pattern is infallible. A sudden positive catalyst—such as a favorable regulatory ruling or a major adoption announcement—could reverse the trend quickly.
2. Continuation Risk: The most likely outcome, based on pattern history, is further downside before a bottom. The $48,000 to $55,000 range represents a 10-20% additional drop from current levels.
3. Liquidity Risk: During intense bearish phases, trading volumes can dry up on the way down, making it harder to execute trades at desired prices.
Mitigation Strategies:
- Dollar-Cost Averaging (DCA): Instead of buying a lump sum, consider investing fixed amounts at regular intervals. This reduces the risk of buying at a peak.
- Wait for a Second Signal: Don’t act on a single candle. Wait for at least one more month of data to confirm a reversal or continuation.
- Use Stop-Losses: If you’re trading, set stop-losses below key support levels to limit potential losses.
Expert Consensus: Most technical analysts agree that the June Marubozu is a significant warning, but they emphasize the importance of context. The pattern is most powerful when combined with other indicators like volume, market sentiment, and macro conditions. This is not a reason to panic, but a reason to be cautious and prepared.
Quick Start Guide: How to Spot This Pattern Yourself
Here’s how you can identify a Marubozu candlestick on your own charts:
1. Open a Price Chart: Go to TradingView, CoinGecko, or your preferred crypto charting platform.
2. Set Timeframe: Select “Monthly” timeframe to see each month as a single candle.
3. Look for a Solid Body: Find a candle where the body is large and solid in color (red for bearish, green for bullish).
4. Check the Wicks: Examine both ends. A true Marubozu has no visible wicks—the open and close are the high and low of the period.
5. Confirm with Volume: Check that trading volume was elevated or at least average during that period. A Marubozu on low volume is less significant.
Common Mistakes to Avoid:
- ❌ Mistaking a “long red candle” (which has small wicks) for a true Marubozu (which has no wicks).
- ❌ Assuming a single Marubozu guarantees a trend will continue—always wait for confirmation.
- ❌ Panicking and selling at the bottom. Remember, this pattern is a warning, not a prediction.
Where to Learn More: Check CryptoSimplified.net’s glossary for more candlestick patterns and our guide to “Reading Crypto Charts for Beginners.”
Future Outlook: What’s Next
Looking ahead, the key questions for Bitcoin are whether July can provide the buyer resistance that June lacked. Several scenarios are possible:
1. Continued Downside (Bearish): If July also shows bearish dominance or a small body with low trading volume, it could confirm that the market hasn’t found a bottom yet. The $48,000 to $55,000 range becomes the next target.
2. Reversal Attempt (Neutral): A July candle with a long lower wick (indicating buyer defense) or a small green body would signal that bulls are starting to step in. This would be the first positive sign after the June Marubozu.
3. Unexpected Catalyst (Bullish): A major positive event—such as a surprise ETF approval in a new region, a favorable regulatory ruling, or a macroeconomic shift—could create buying pressure that invalidates the bearish signal.
The timeline for a potential bottom is uncertain. Analysts suggest that the bottoming process could take 1-3 months, consistent with the pattern of previous corrections. As always, this is a rapidly evolving situation that requires monitoring.
Key Takeaways
- The June 2026 Marubozu candle is a rare and powerful bearish signal, showing that sellers completely dominated with no buyer resistance for an entire month.
- This pattern doesn’t guarantee further losses, but it is a strong warning that the current downtrend has momentum, making it risky to “buy the dip” prematurely.
- Understanding candlestick patterns helps you make informed decisions based on market data rather than emotions or hype.
- Always wait for confirmation from subsequent candles before acting on any single pattern, and consider the broader market context.
,
“datePublished”: “2026-07-01”,
“dateModified”: “2026-07-01”,
“mainEntity”: {
“@type”: “Thing”,
“name”: “Bitcoin Marubozu Candlestick Pattern”
}
}

The Trader’s Secret Weapon: How to Build a Trading Journal That Actually Works
Most traders lose money not because they don’t have a good strategy, but because they don’t have a clear record of what they did, why they did it, and what happened next. Your trading journal is your personal flight recorder—it turns every trade into a lesson and every loss into data that makes you better. Let’s dive into the best practices that turn a simple notebook into your most powerful trading tool.
How It Works
A trading journal isn’t just a list of P&L numbers. It’s a structured log that captures the full story of each trade. The magic happens when you review your entries regularly and look for patterns—both in your wins and your losses.
The Setup
Here’s what a high-quality journal entry should include:
Looking for altcoin opportunities and smooth trading? Try KuCoin.
- Date & Time – When did you enter and exit?
- Market & Pair – e.g., BTC/USDT, ETH/BTC
- Trade Direction – Long or short
- Entry Price, Exit Price, Position Size – The raw numbers
- Setup Type – Breakout, pullback, reversal, etc.
- Emotional State – Were you feeling confident, anxious, or bored?
- Trade Rationale – Why did you take this trade? Be specific.
- Result – Profit or loss in both pips/points and percentage
- Lessons Learned – What would you do differently?
You can use a physical notebook, a spreadsheet, or a dedicated app like Edgewonk or Tradervue. The tool doesn’t matter—consistency does.
How to Review Like a Pro
Don’t just log and forget. Set aside 15–30 minutes every weekend to review your week:
- Win Rate vs. Risk/Reward – Are you winning often but losing big? Or winning rarely but making it count?
- Emotional Patterns – Do you revenge trade after a loss? Do you get overconfident after a win?
- Setup Performance – Which setups are your moneymakers? Which ones need to be dropped?
- Discipline Score – Rate yourself on sticking to your plan (1–10). Track this over time.
Risk Management
Your journal is your best risk management tool. Here’s how to use it to protect your capital:
- Set a Maximum Daily Loss – If you hit it, stop trading. Log the reason.
- Track Your Risk Per Trade – Never risk more than 1–2% of your account on a single trade.
- Flag High-Risk Trades – Trades taken outside your plan or during emotional states should be marked in red.
- Review Your Worst Trades – The goal isn’t to feel bad, but to identify the trigger so you can avoid it next time.
Conclusion
A trading journal isn’t optional—it’s the difference between gambling and professional trading. Start simple. Log five trades this week. Review them on Sunday. Look for one pattern to fix. Over time, your journal will become your roadmap to consistency, confidence, and profitability. The best traders aren’t the ones who never lose—they’re the ones who learn faster than everyone else.
Restaking Explained: EigenLayer and Beyond – The Ultimate Guide to Crypto Restaking
Introduction
Restaking is one of the most transformative innovations in the crypto ecosystem since the advent of liquid staking. By allowing staked assets to be reused across multiple protocols, restaking unlocks new layers of capital efficiency and security. This guide explains what restaking is, how EigenLayer pioneered it, and what the future holds for this rapidly growing sector.
Key Concepts
What Is Restaking?
Restaking is the process of taking already-staked tokens (like ETH on Ethereum) and using them to secure additional protocols or services. Instead of your staked assets sitting idle, they can be rehypothecated to provide economic security to multiple networks simultaneously.
EigenLayer: The Pioneer
EigenLayer is a protocol built on Ethereum that introduces restaking. It allows ETH stakers to opt into validating new modules called Actively Validated Services (AVSs). By restaking, you earn additional rewards while contributing to the security of these services. EigenLayer’s smart contracts manage the slashing conditions, ensuring that misbehavior is penalized across all protocols.
How Restaking Works
- Stake ETH on Ethereum (via Lido, Rocket Pool, or directly).
- Deposit staked ETH into EigenLayer’s restaking contracts.
- Choose AVSs to validate (e.g., data availability layers, bridges, or oracles).
- Earn rewards from both Ethereum staking and AVS fees.
Beyond EigenLayer
Other projects like Renzo, Kelp DAO, and Puffer Finance are building liquid restaking tokens (LRTs) that simplify the process. These tokens represent your restaked position and can be used in DeFi, further increasing capital efficiency.
Pro Tips
- Understand slashing risks: Restaking amplifies risk. If an AVS you validate misbehaves, your entire restaked balance can be slashed.
- Diversify AVSs: Don’t put all your restaked ETH into one service. Spread across multiple AVSs to mitigate risk.
- Use liquid restaking tokens: LRTs like ezETH or rsETH allow you to stay liquid while earning restaking rewards.
- Monitor gas costs: Restaking involves multiple transactions. Use low-fee periods to minimize costs.
FAQ Section
What is the difference between staking and restaking?
Staking locks tokens to secure a single blockchain (e.g., Ethereum). Restaking takes those already-staked tokens and uses them to secure additional protocols, earning extra rewards.
Is restaking safe?
Restaking introduces additional slashing risks. If the AVS you validate is compromised or behaves maliciously, you can lose a portion of your staked assets. Always research AVSs before committing.
Can I restake any token?
Currently, restaking is primarily available for ETH and liquid staking derivatives (stETH, rETH). Some protocols are expanding to other assets like LSTs on other chains.
What are liquid restaking tokens (LRTs)?
LRTs are tokens that represent your restaked position. They can be traded, used as collateral, or deployed in DeFi while still earning restaking rewards. Examples include ezETH (Renzo) and rsETH (Kelp DAO).
How do I start restaking?
You can start by staking ETH on Ethereum, then depositing your staked ETH into EigenLayer’s app. Alternatively, use a liquid restaking protocol like Renzo or Kelp DAO for a simpler experience.
Conclusion
Restaking is reshaping crypto security by making capital work harder. EigenLayer has opened the door to a new paradigm where staked assets can secure multiple networks, driving efficiency and innovation. As the ecosystem matures, expect more AVSs, better risk management tools, and deeper integration with DeFi. For more details on this, check out our guide on Animoca Brands Chairman Declares Metaverse Over, Predicts 100 Billion AI Agents. You might also be interested in reading about Vitalik Buterin Reveals 90% Net Worth in ETH During Foundation Restructuring.