
How to Read a Smart Contract Audit Report: A Complete Guide for Crypto Investors
Learn to decode audit findings, understand risk ratings, and make informed investment decisions.
Introduction
Smart contract audits are critical for verifying the security of decentralized applications (dApps) and DeFi protocols. However, audit reports can be dense and technical. This guide breaks down how to read a smart contract audit report, interpret findings, and assess risk levels—so you can invest with confidence.
Key Concepts
- Audit Scope: The specific contracts and functions reviewed. Always check if the audit covers the entire protocol or only selected modules.
- Risk Severity: Issues are typically classified as Critical, High, Medium, Low, or Informational. Critical and High findings require immediate attention.
- Finding Status: Look for statuses like “Fixed,” “Acknowledged,” or “Partially Resolved.” Unresolved high-severity issues are red flags.
- Code Snippets: Auditors often include vulnerable code and recommended fixes. Review these to understand the actual risk.
- Auditor Reputation: Reports from firms like Trail of Bits, OpenZeppelin, or Certik carry more weight. Check if the auditor is independent and well-regarded.
Pro Tips
- Always read the executive summary first—it provides a high-level overview of the audit’s conclusions.
- Focus on unresolved critical and high-severity issues. Even one can lead to a major exploit.
- Cross-reference the audit date with the project’s development activity. An audit from six months ago may not reflect current code.
- Look for centralization risks—e.g., admin keys that can drain funds or pause contracts.
- Don’t rely on a single audit. Multiple audits from different firms increase confidence.
FAQ Section
What does a “Critical” finding mean?
A critical finding indicates a vulnerability that can lead to loss of funds, contract failure, or complete compromise. It must be fixed before deployment.
Can a project be safe if it has unresolved medium-severity issues?
It depends. Medium issues may not be exploitable immediately, but they can become critical under certain conditions. Always assess the context.
How often should a project be audited?
Ideally, after every major code update. For active DeFi protocols, quarterly audits are a good practice.
What if the audit report is outdated?
An outdated audit is a major red flag. The project may have introduced new vulnerabilities since the last review.
For more details on this, check out our guide on Cold Storage vs Hot Wallets: Which Should You Choose?.
You might also be interested in reading about Real World Assets (RWA): How Tokenization Changes Investing.
Conclusion
Reading a smart contract audit report is a skill every crypto investor should develop. By focusing on severity ratings, finding status, and auditor reputation, you can better assess the security of any DeFi project. Always combine audit analysis with other due diligence—no audit guarantees 100% safety, but it’s a powerful tool in your risk management toolkit.
Master Supply and Demand Zones: The Hidden Blueprint of Smart Money Moves
Imagine being able to see where the biggest traders are placing their bets before the price even moves. That’s the power of supply and demand zones. Unlike support and resistance lines, which are just single price levels, these zones represent real areas of imbalance between buyers and sellers. When you learn to spot them, you stop chasing price and start anticipating reversals with confidence.
How It Works
At its core, supply and demand trading is about identifying where large institutional orders sit. A supply zone is a price area where sellers have overwhelmed buyers, causing a sharp drop. A demand zone is the opposite — where buyers stepped in aggressively and drove price higher. These zones act like magnets: when price returns to them, the same imbalance often repeats. The key is to look for strong, impulsive moves away from a base of consolidation. That base is your zone.
The Setup
To trade this strategy, follow these steps:
1. Find a strong move – Look for a candle that shoots up or down with high volume and little to no wick.
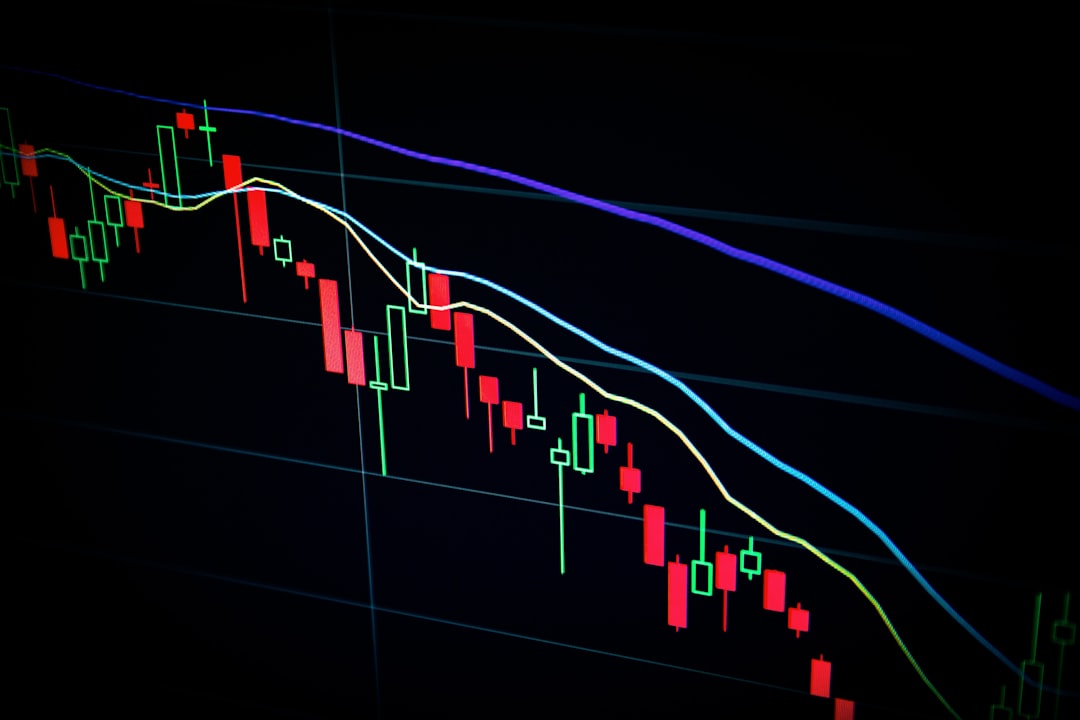
2. Identify the base – The consolidation area just before the move is your zone. Draw a rectangle covering the range of those few candles.
3. Mark the zone – For a demand zone, draw from the low of the base to the high of the base. For supply, reverse it.
4. Wait for a retest – Let price come back into the zone. Do not enter immediately; wait for a confirming candle (like a pin bar or engulfing pattern) to signal the imbalance is still active.
5. Enter and set stops – Place your entry at the confirmation candle close. For demand trades, set your stop loss just below the zone. For supply trades, just above it.
Risk Management
Supply and demand zones are not magic — they fail sometimes. Protect yourself with solid risk management:
- Risk no more than 1-2% of your account per trade.
- Always use a stop loss just outside the zone. A break into the zone and a close beyond it means the imbalance has shifted.
- Take partial profits at the nearest resistance (for demand) or support (for supply), and let the rest run to the next zone.
- Avoid trading zones that are too wide — a zone with a large range means more uncertainty. Stick to tight, clean zones.
Conclusion
Supply and demand zones give you a trader’s edge by revealing where the big money is hiding. They turn chaotic charts into a clear roadmap of price behavior. Start by practicing on a demo account: mark every strong move and wait for the retest. With patience and discipline, you’ll soon see that price respects these zones again and again. Trade the zones, not the noise.
DePIN Explained: Earning Passive Income with Infrastructure
Decentralized Physical Infrastructure Networks (DePIN) are reshaping how we think about ownership, sharing, and earning. By contributing real-world resources—like bandwidth, storage, compute power, or even sensor data—anyone can become a micro-infrastructure provider and earn passive income in crypto. This guide breaks down everything you need to know about DePIN, from key concepts to actionable tips.
Key Concepts
What is DePIN?
DePIN stands for Decentralized Physical Infrastructure Networks. It refers to blockchain-powered protocols that incentivize individuals to deploy and share physical hardware or resources. Instead of relying on centralized giants (e.g., Amazon Web Services or Google), DePIN networks are built and maintained by a global community of contributors.
How Does It Work?
Participants purchase or already own hardware (e.g., a router, a hard drive, a GPU, a weather station) and connect it to a DePIN protocol. The protocol verifies resource contributions via on-chain or off-chain proofs and rewards contributors with native tokens. These tokens can be held, traded, or staked for additional yield.
Popular DePIN Categories
- Decentralized Wireless (DeWi): Helium (HNT) for IoT and 5G hotspots, Pollen Mobile for mobile coverage.
- Decentralized Storage: Filecoin (FIL), Arweave (AR), Storj (STORJ) for renting out unused hard drive space.
- Decentralized Compute: Render Network (RNDR) for GPU rendering, Akash Network (AKT) for cloud compute.
- Sensor Networks: Hivemapper (HONEY) for dashcam mapping, DIMO for vehicle data.
- Bandwidth Sharing: Theta Network (THETA) for video streaming, Meson Network for CDN bandwidth.
Pro Tips
- Start with low-cost hardware: Many DePIN projects allow you to use existing devices (e.g., a Raspberry Pi, an old laptop, or a smartphone). Avoid over-investing before you understand the rewards structure.
- Check tokenomics carefully: Look at inflation rates, reward halving schedules, and whether the token has real utility beyond speculation. Sustainable projects have a clear link between resource demand and token value.
- Diversify across networks: Don’t put all your hardware into one DePIN project. Spread your resources across wireless, storage, and compute to hedge against protocol risk.
- Monitor operational costs: Electricity, internet bandwidth, and hardware maintenance eat into profits. Calculate your net yield after expenses.
- Use a low-fee exchange for rewards: When you earn DePIN tokens, you’ll likely want to sell or swap them. High trading fees can erode your passive income.
FAQ Section
Is DePIN really passive income?
Yes, but it’s not completely hands-off. You’ll need to set up hardware, maintain internet connectivity, and occasionally update software. Once running, rewards accrue automatically.
How much can I earn from DePIN?
Earnings vary widely. A Helium hotspot might earn $5–$50/month depending on location and network activity. A high-end GPU on Render could earn hundreds per month. Always research current reward rates.
What are the risks?
Key risks include hardware failure, token price volatility, protocol changes, and regulatory uncertainty. Never invest more than you can afford to lose.
Do I need technical skills?
Basic technical skills help, but many projects offer plug-and-play hardware or detailed guides. Communities on Discord and Telegram are very supportive.
Can I participate without buying new hardware?
Yes. Some DePIN projects allow you to contribute resources you already own, like unused storage on a PC or bandwidth from a home router. Check project requirements before purchasing anything.
Conclusion
DePIN represents a paradigm shift in infrastructure ownership—turning everyday users into active stakeholders in global networks. By contributing physical resources, you can earn a steady stream of passive income while supporting decentralized alternatives to Big Tech. Start small, choose projects with strong fundamentals, and always keep an eye on costs and tokenomics.
For more details on this, check out our guide on Cold Storage vs Hot Wallets: Which Should You Choose? A Complete Crypto Security Guide.
You might also be interested in reading about The Rise of AI Agents in Crypto: A Complete Guide.
Former Fidelity Manager Warns AI Crash Could Be 17x Worse Than Dot-Com Collapse
March 27, 2025 — Former Fidelity fund manager George Noble has issued a stark warning that a potential AI bubble burst could cause 17 times more damage than the dot-com collapse, which erased approximately $5 trillion from the Nasdaq. Noble tied his forecast to massive capital flows into AI infrastructure, arguing that financial fallout could extend far beyond technology companies if expected returns fail to materialize.
Immediate Details & Direct Quotes
Want to trade this news? Bitget offers professional charting tools and deep liquidity.
Noble’s warning comes as Polymarket traders have raised the odds of an AI bubble bursting in 2026 above 17%, after recently falling from 30% to 14%. Contracts using different resolution criteria placed the likelihood between 16% and 24% as traders weighed falling technology shares, revenue concerns, and weakness across global markets.
“The fallout from this could really be much more significant,” Noble said while discussing the rise in AI capital spending. The former fund manager emphasized that the scale of investment flowing into AI development has created unprecedented risk exposure across multiple sectors.
The warning aligns with fresh pressure on semiconductor and technology shares. The Wall Street Journal reported that U.S. stock futures fell on Thursday as AI-related anxiety spread from Asian markets, where SK Hynix and Samsung Electronics dropped almost 9%. Both South Korean chipmakers plan to spend billions of dollars on semiconductor plants and AI capacity, raising questions about whether AI service revenue will justify the industry’s expanding infrastructure bill.
Market Context & Reaction
IBM has added to the unease after shares suffered their steepest daily fall since 1968, dropping almost 25% earlier this week. Market data showed IBM closing another 2.7% lower at $211.20 on Wednesday, taking its decline over several sessions past 26%. The selloff erased tens of billions of dollars from IBM’s market value and weighed on other software and information technology stocks.
A draft U.S. Treasury Department report has also examined how an AI downturn could move through the economy. Drawing on research from the University of Texas at Austin, the report found that AI companies have become more closely linked to the U.S. economy than internet companies were during the dot-com period.
Under the report’s downside scenario, disappointing productivity or profits could hurt private credit, chipmakers, cloud providers, electric utilities, and companies financing data centers. The Treasury did not predict an imminent crash but listed electricity shortages, financing limits, supply chain disruptions, and geopolitical tensions among the risks facing the sector.
Background & Historical Context
Ray Dalio has separately argued that liquidity, rather than weak technology, could break the AI boom. The Bridgewater Associates founder explained during a television interview that investors often mistake rising asset values for money they can readily spend. Dalio used private companies to illustrate the risk: a business can receive a billion-dollar valuation after raising far less in actual capital, but shareholders cannot use that paper wealth without selling. Stress would emerge if many investors attempted to turn those valuations into cash simultaneously.
Bernstein and Cummings have pointed to another pressure building beneath the boom. In a recent Substack post, the economists wrote that the AI bubble was “still inflating,” while technology investment had reached nearly 5% of U.S. GDP, above levels recorded during the dot-com era. Their analysis also found that large technology companies were committing enough capital to AI projects to reduce their cash reserves.
What This Means
For investors, the combination of Noble’s warning, Dalio’s liquidity concerns, and rising Polymarket odds suggests growing unease about AI sector valuations. The immediate risk centers on whether AI earnings can catch up with the money already committed to infrastructure projects.
Short-term, investors should watch for continued volatility in semiconductor stocks and AI-focused companies as earnings reports roll in. The IBM warning about corporate budgets shifting from software to AI infrastructure signals potential revenue pressure across the broader tech sector.
Long-term, the Treasury report’s downside scenario highlights interconnected risks that could amplify losses beyond technology companies if an AI downturn materializes. Investors in private credit, utilities, and data center financing markets may face exposure they haven’t fully priced in. As always, this is not financial advice — conduct your own research before making investment decisions.
—

The 1% Rule: The Golden Shield of Smart Trading
Let’s be honest: the hardest part of trading isn’t finding the next 100x gem or calling the perfect entry. It’s keeping your account alive long enough to let your edge play out. That’s where the 1% Rule comes in—a simple, non-negotiable risk management principle that separates disciplined traders from gamblers.
If you’re a beginner or intermediate trader, this one rule will save you more money than any indicator ever could. Let’s break it down.
How It Works
The 1% Rule states: Never risk more than 1% of your total trading capital on a single trade.
This isn’t about how much you buy—it’s about how much you’re willing to lose if the trade goes against you. For example, if your account is $10,000, your maximum loss per trade is $100. That includes your stop-loss, fees, and slippage.
The Setup
To apply the rule, you need three things:
1. Account size – Your total capital (e.g., $10,000).
2. Entry price – Where you buy the asset.

3. Stop-loss price – Where you exit if wrong.
Then calculate your position size:
> Position Size = (Account × 1%) ÷ (Entry Price – Stop-Loss Price)
Example:
- Account: $10,000 → Max risk = $100
- Entry: $50
- Stop-loss: $45 (risk of $5 per share)
- Position size = $100 ÷ $5 = 20 shares ($1,000 total value)
This means you’re only risking $100, even though you’re buying $1,000 worth of the asset.
Why 1% and Not 2% or 5%?
Because survival is your first strategy. A 50% loss requires a 100% gain to break even. With 1% risk per trade, you can lose 10 times in a row and still have 90% of your capital. That gives you room to learn, adapt, and win.
As you gain experience, you can adjust—but 1% is the gold standard for building consistency.
Risk Management: The Real Edge
The 1% Rule forces you to:
- Plan every trade before you enter.
- Accept losses as part of the process.
- Avoid revenge trading because your losses stay small.
Pair it with a risk-reward ratio of at least 1:2 (risk $1 to make $2), and you’ve got a system that works over time.
Conclusion
Trading isn’t about being right—it’s about managing risk so you can keep playing. The 1% Rule is your shield. Start using it today, and watch your mindset shift from “I hope this wins” to “I know my risk is controlled.”
Remember: Small losses, big wins, repeat. That’s how you build wealth in crypto.
US Treasury Bills on Blockchain: The Risk-Free Rate On-Chain
US Treasury Bills (T-Bills) are short-term government debt instruments backed by the full faith and credit of the United States. Traditionally, they are traded over-the-counter or on exchanges with settlement times of T+1 or T+2. On-chain tokenization transforms these instruments into digital tokens that can be traded 24/7 on blockchain networks, enabling fractional ownership, instant settlement, and global accessibility. This guide explores how T-Bills are moving on-chain, the investment opportunities and risks, and how you can participate.
How It Works: From Off-Chain to On-Chain
The process of tokenizing US Treasury Bills involves several steps to ensure legal compliance and asset integrity:
- Asset Selection & SPV Creation: A Special Purpose Vehicle (SPV) is established to hold the actual T-Bills. The SPV is a legal entity that isolates the assets from the sponsor’s balance sheet.
- Tokenization: The SPV issues blockchain-based tokens (e.g., ERC-20 on Ethereum) that represent ownership of the underlying T-Bills. Each token typically corresponds to a specific dollar value (e.g., 1 token = $1 of T-Bill exposure).
- Oracle & Custody: Oracles (like Chainlink) feed real-time price data and interest accrual information on-chain. The physical T-Bills are held by a regulated custodian (e.g., State Street, BNY Mellon).
- Secondary Market Trading: Tokens can be traded on decentralized exchanges (DEXs) or through specialized platforms, providing 24/7 liquidity. Smart contracts handle settlement and interest distribution automatically.
Investment Analysis: Pros, Cons, and Risks
On-chain T-Bills offer unique advantages but also carry specific risks that investors must understand.
Pros
- 24/7 Liquidity: Unlike traditional markets, on-chain T-Bills can be traded any time, including weekends and holidays.
- Fractional Ownership: Minimum investment thresholds are dramatically lower (e.g., $1 vs. $1,000+), opening access to retail investors.
- Transparency: All transactions and holdings are recorded on a public blockchain, reducing counterparty opacity.
- Programmable Yield: Smart contracts can automatically distribute interest payments to token holders without manual intervention.
Cons & Risks
- Regulatory Uncertainty: Tokenized securities may fall under SEC or other regulatory frameworks. Changes in law could impact token legality or tax treatment.
- Smart Contract Risk: Bugs or exploits in the token contract or the underlying DeFi protocol could lead to loss of funds.
- Custodial Risk: The SPV and custodian are centralized points of failure. If the custodian becomes insolvent, token holders may face delays or losses.
- Oracle Risk: If the oracle providing price data is manipulated or fails, the token price may deviate from the underlying asset.
For a broader market view, check out our analysis on Stop Loss Placement: The Art of Knowing When to Walk Away. Investors often compare this to The Ultimate Guide to Airdrop Farming: Turn Free Tokens Into Real Profits.
Tool Recommendation
To practice trading tokenized assets in a safe environment, Binance offers a demo trading feature where you can simulate buying and selling without real funds. You can practice this setup safely on Binance. Create an account here to explore the platform.
FAQ Section
What is the yield on tokenized US Treasury Bills?
The yield mirrors the underlying T-Bill rate, typically the 13-week or 26-week Treasury rate, minus management fees (usually 0.15% to 0.50% annually). Current yields can be tracked on platforms like RWA.xyz or through issuer dashboards.
Are on-chain T-Bills insured or protected?
No, they are not FDIC insured. The underlying T-Bills are backed by the U.S. government, but the tokenization layer (smart contracts, SPV, custodian) introduces additional risks. Some issuers may have private insurance for custodial assets, but this is not universal.
How do I redeem my tokens for fiat currency?
Redemption processes vary by issuer. Typically, you send tokens back to the issuer’s smart contract, and after a settlement period (e.g., 1-3 business days), you receive USD via bank transfer or stablecoin. Some platforms also allow instant redemption via a liquidity pool.
Conclusion
Tokenized US Treasury Bills represent a significant bridge between traditional finance and DeFi, offering the risk-free rate with the benefits of blockchain technology. While the asset class is still maturing, institutional adoption (e.g., BlackRock’s BUIDL fund) signals strong long-term viability. Investors should weigh the convenience and accessibility against regulatory and smart contract risks. For those ready to explore, starting with a demo account on a regulated exchange is a prudent first step.
Understanding Gas Fees: How to Save Money on Ethereum
Ethereum gas fees can be a significant cost for users interacting with the network. This comprehensive guide explains what gas fees are, why they fluctuate, and provides actionable strategies to minimize your expenses.
Key Concepts
What Are Gas Fees? Gas fees are payments made by users to compensate for the computational energy required to process and validate transactions on the Ethereum blockchain. They are measured in gwei (1 gwei = 0.000000001 ETH).
How Gas Fees Work: Each transaction requires a certain amount of gas (units of computational work). The total fee is calculated as: Gas Units × (Base Fee + Priority Fee). The base fee is burned, while the priority fee goes to validators.
Why Gas Fees Fluctuate: Network congestion is the primary driver. When demand for block space is high (e.g., during NFT mints or DeFi activity), fees spike. Time of day and day of the week also affect prices.
Pro Tips
- Time Your Transactions: Use tools like Etherscan Gas Tracker to monitor low-fee periods (typically weekends or late nights UTC).
- Use Layer 2 Solutions: Optimism, Arbitrum, and Base offer significantly lower fees. Bridge your ETH to L2 for frequent transactions.
- Set a Custom Gas Limit: Avoid overpaying by setting a gas limit close to the estimated amount (e.g., 21,000 for simple ETH transfers).
- Use EIP-1559 Wallets: Wallets like MetaMask allow you to adjust priority fees. Set a lower priority fee during non-peak hours.
- Batch Transactions: Combine multiple actions (e.g., approvals and swaps) into one transaction using DeFi aggregators.
FAQ Section
What is the average gas fee on Ethereum?
Average fees vary widely. In 2024, they range from $1 to $50 depending on network congestion. Use real-time trackers for current estimates.
Can I cancel a pending transaction with high gas?
Yes. Most wallets allow you to replace a pending transaction by sending a new one with the same nonce and a higher gas price (speed up) or a zero-value transaction (cancel).
Are gas fees refundable?
No. Gas fees are paid to validators and are non-refundable, even if the transaction fails. Always check gas estimates before confirming.
What is the cheapest time to use Ethereum?
Historically, weekends (especially Sunday mornings UTC) and late night hours (midnight to 6 AM UTC) see lower fees.
Conclusion
Understanding and managing Ethereum gas fees is essential for cost-effective blockchain usage. By timing transactions, leveraging Layer 2 solutions, and using smart wallet settings, you can save significantly. For more details on this, check out our guide on Robinhood Chain Nears Base With 7.6M Daily Transactions Just 11 Days After Launch. You might also be interested in reading about Stop Loss Placement: Three Smart Strategies to Protect Your Crypto Trades.
Ledger Launches Open-Source Toolkit for AI Agents to Manage Crypto
July 16, 2026 — Ledger has introduced Ledger Agent Stack, an open-source toolkit that allows AI agents to interact with crypto wallets by reading balances and preparing transactions, while requiring every sensitive action to be approved on a physical Ledger hardware device before execution.
Immediate Details & Direct Quotes
Looking for altcoin opportunities and smooth trading? Try KuCoin.
The hardware wallet maker announced Ledger Agent Stack as the first release under its 2026 AI roadmap. The toolkit lets autonomous software access wallet balances, analyze portfolios, and propose payments, but private keys never leave the user’s physical control.
“Agents propose. Humans approve,” Ledger’s team wrote in a press release shared with CoinDesk. “Crypto wallets have protected billions on this standard for years,” said Ian Rogers, Ledger’s chief human agency officer. “Ledger Agent Stack allows your agent to use these wallets just as easily as humans.”
The toolkit provides developers with pre-built tools to integrate Ledger support into AI applications without building everything from scratch. It works with both personal and institutional crypto wallets, keeping the most critical security step—transaction approval—locked behind the Ledger hardware device.
Ledger is extending hardware security beyond just crypto. New features allow developers to store sensitive AI credentials securely and use Ledger devices as physical security keys for logging into services such as GitHub, Discord, and 1Password.
Market Context & Reaction
As of the announcement date, Ledger’s move addresses growing security concerns around AI agents handling financial tasks. The company’s approach prevents autonomous agents from moving funds or accessing sensitive credentials if they become compromised.
“Even if an attacker compromises an AI agent, they would still need the owner’s physical approval on a Ledger device before moving funds or accessing protected information,” the company stated.
This launch positions Ledger at the intersection of two rapidly growing sectors: hardware crypto security and AI-powered financial automation. The hardware wallet maker is betting that human oversight will become a critical security layer as AI agents take on increasingly complex financial tasks.
Market reaction to the announcement was not immediately available at press time. The toolkit is open-source, meaning developers can freely access and build upon the technology.
Background & Historical Context
Ledger has established itself as a leading hardware wallet provider, securing billions of dollars in cryptocurrency assets. The company’s core security model has always required physical approval for transactions through its hardware devices.
The Ledger Agent Stack launch follows a 2020 data breach where the company faced a customer data exposure through a payment processor. Since then, Ledger has focused on expanding its security offerings beyond basic crypto storage.
The company’s 2026 AI roadmap signals a strategic shift toward enabling AI agents while maintaining the security principles that made Ledger a trusted name in crypto storage. This approach directly addresses industry-wide concerns about AI agents having unchecked access to financial assets.
What This Means
For crypto users, Ledger Agent Stack enables AI-powered portfolio management and automated trading strategies without sacrificing private key security. Users retain final approval on all transactions.
Developers gain a standardized way to add hardware-backed security to AI crypto applications, potentially accelerating adoption of agent-based financial tools. The open-source nature allows community auditing and improvement.
The near-term impact will likely focus on personal wallet management and basic portfolio analysis. Longer-term, institutional applications could emerge as the toolkit matures.
Users should conduct their own research before integrating any AI agent with their crypto wallets. This announcement is not financial advice.
—
Master the MACD Histogram: A Simple Yet Powerful Trading Strategy
If you’ve ever stared at a chart full of lines and indicators, wondering which one actually tells you when to buy or sell, you’re not alone. The MACD (Moving Average Convergence Divergence) is one of the most popular momentum indicators out there, but its real power lies in the Histogram. In this post, I’ll show you a clean, beginner-friendly MACD Histogram strategy that can help you spot trend reversals and momentum shifts with confidence.
How It Works
The MACD Histogram represents the difference between the MACD line and its signal line. When the histogram bars are rising (getting taller), momentum is increasing in the direction of the trend. When they start shrinking, momentum is fading — often a warning that a reversal is coming. The key is to watch for divergences and crossovers of the histogram itself.
The Setup
- Timeframe: 1-hour or 4-hour charts work best for swing trading. For day trading, use 15-minute or 30-minute charts.
- Indicators: Add the MACD (12, 26, 9) with histogram visible. No other indicators needed.
- Trend Filter: Optional — a simple 200-period moving average to confirm the overall trend direction.
Bullish Signal (Long Entry)
1. Wait for the histogram to form a higher low while price makes a lower low — this is a bullish divergence.
2. Enter long when the histogram crosses above zero (turns green) after the divergence.

3. Place a stop loss below the recent swing low.
Bearish Signal (Short Entry)
1. Look for a lower high on the histogram while price makes a higher high — bearish divergence.
2. Enter short when the histogram crosses below zero (turns red).
3. Stop loss above the recent swing high.
Example in Action
Imagine Bitcoin is trending down, but you notice the histogram bars are getting smaller (less negative). Price makes a new low, but the histogram doesn’t — that’s your clue. Wait for the histogram to turn positive, then enter long. You’ve caught the reversal early!
Risk Management
No strategy works 100% of the time, so protect your capital:
- Risk per trade: Never risk more than 1-2% of your account.
- Stop loss: Always place a stop at the recent swing high/low, or a fixed percentage (e.g., 2-3% below entry).
- Take profit: Use a 1:2 or 1:3 risk-reward ratio. For example, if you risk $100, aim for $200-$300 profit.
- Avoid trading low volume pairs or during major news events — the histogram can give false signals.
Conclusion
The MACD Histogram is a hidden gem for traders who want to catch momentum shifts before they become obvious. By focusing on divergences and zero-line crossovers, you can filter out noise and trade with the wind at your back. Start practicing on a demo account, keep your risk tight, and let the histogram be your guide. Happy trading!
What is Impermanent Loss? Liquidity Providing Explained
Impermanent loss is one of the most misunderstood risks in decentralized finance (DeFi). If you provide liquidity to an automated market maker (AMM) like Uniswap or PancakeSwap, you need to understand how price changes can reduce your returns—sometimes even turning a profitable trade into a loss. This guide breaks down impermanent loss in simple terms, shows you how it works, and gives you practical tips to manage it.
Key Concepts
What is Impermanent Loss?
Impermanent loss occurs when the price of tokens in a liquidity pool changes compared to when you deposited them. The larger the price change, the more severe the loss. It’s called “impermanent” because if the prices return to their original ratio, the loss disappears. However, if you withdraw while prices are different, the loss becomes permanent.
How Does It Happen?
When you provide liquidity, you deposit two tokens in a fixed ratio (e.g., 50% ETH and 50% USDC). The AMM algorithm automatically adjusts the pool’s composition to maintain a constant product. If one token’s price rises sharply, arbitrage traders will buy the cheaper token from your pool, leaving you with more of the depreciating asset. When you withdraw, you get less value than if you had simply held the tokens.
Example
Imagine you deposit 1 ETH ($2,000) and 2,000 USDC into a 50/50 pool. The total value is $4,000. If ETH doubles to $4,000, arbitrageurs will buy ETH from the pool until the ratio rebalances. You’ll end up with roughly 0.707 ETH and 2,828 USDC—worth about $5,656. But if you had just held, you’d have 1 ETH ($4,000) + 2,000 USDC = $6,000. The difference ($344) is your impermanent loss.
Pro Tips
- Choose stablecoin pairs: Pools like USDC/USDT have minimal price divergence, so impermanent loss is near zero.
- Look for high fee pools: Pools with higher trading fees (e.g., 0.3% or 1%) can offset impermanent loss over time.
- Use concentrated liquidity: Platforms like Uniswap v3 let you set price ranges, reducing exposure to large price swings.
- Monitor volatility: Avoid providing liquidity to highly volatile assets unless you’re confident in the fees earned.
FAQ Section
Is impermanent loss always bad?
Not necessarily. If the trading fees you earn exceed the impermanent loss, you still come out ahead. It only becomes a problem when fees are too low relative to price volatility.
Can impermanent loss be avoided?
You can’t avoid it entirely in volatile pairs, but you can minimize it by choosing stablecoin pools, using single-sided liquidity protocols, or opting for platforms with dynamic fee structures.
How is impermanent loss calculated?
The formula depends on the price ratio change. A common approximation is: IL = 2 * sqrt(price_ratio) / (1 + price_ratio) – 1. For a 2x price change, IL is about 5.7%; for a 4x change, it’s about 20%.
For more details on this, check out our guide on KYC vs No-KYC Exchanges: Privacy Guide 2026.
You might also be interested in reading about Stablecoin Yield Strategies: Low Risk Farming – A Complete Guide for 2025.
Conclusion
Impermanent loss is a key risk every liquidity provider must understand. While it can eat into your profits, smart strategies—like picking the right pairs, monitoring fees, and using advanced tools—can help you stay ahead. Start small, track your positions, and always compare your returns against simply holding the tokens. With the right approach, liquidity providing can still be a rewarding part of your DeFi portfolio.